Issue Date: Thursday, July 8, 2021
Issue Time: 9:15 AM MDT
Summary:
Wednesday, July 7 saw a high-pressure ridge settle into the southwest, bringing subsidence and higher temperatures to the state. Along with the ridge, a dryer air mass prevented all but very isolated showers, which for many was welcome news after several days of wet weather and flooding. Conversely, the warm and dry weather contributed to an increase in heat and fire activity for the Sylvan Fire and Muddy Slide fires yesterday.
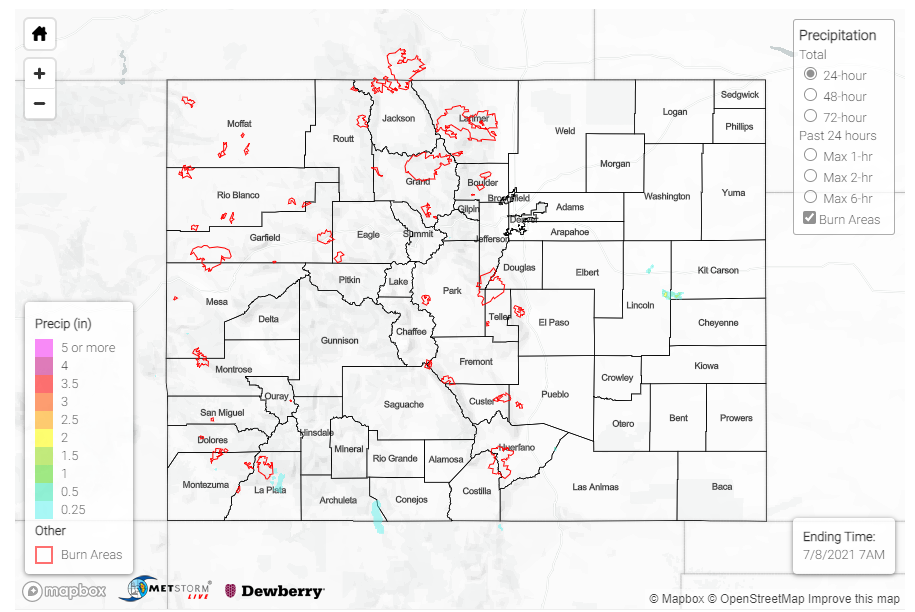
The only notable precipitation in Colorado was around Durango in the Southwest Slope, where between 0.38-0.57 inches was reported after an isolated afternoon storm according to CoCoRaHS and MesoWest gages. There was also an isolated cell overnight on the Eastern Plains. However, due to the rural location there are no gage reports to verify magnitude. For rainfall estimates in your area check out the State Precipitation Map at the bottom of today’s post.
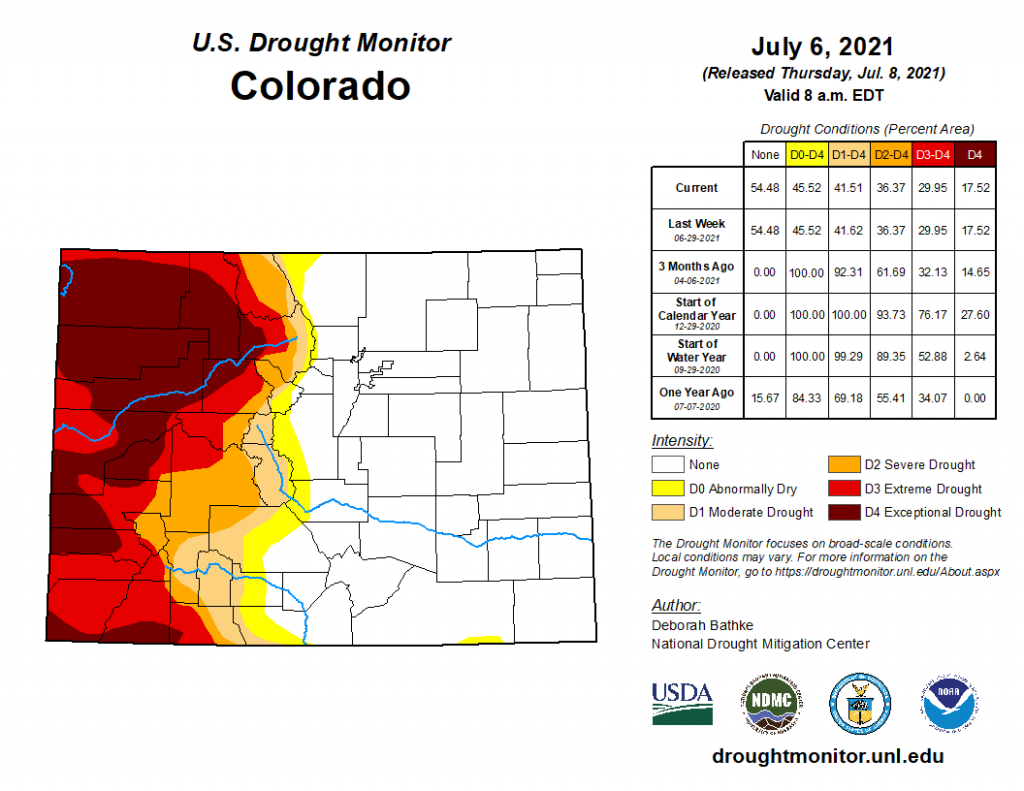
It has been a few weeks since the Drought Monitor was shared here, largely because there hasn’t been much change in drought conditions. The drastic divide between the eastern and western halves of the state still persists, with much of the west experiencing exceptional drought and no drought conditions in the east.
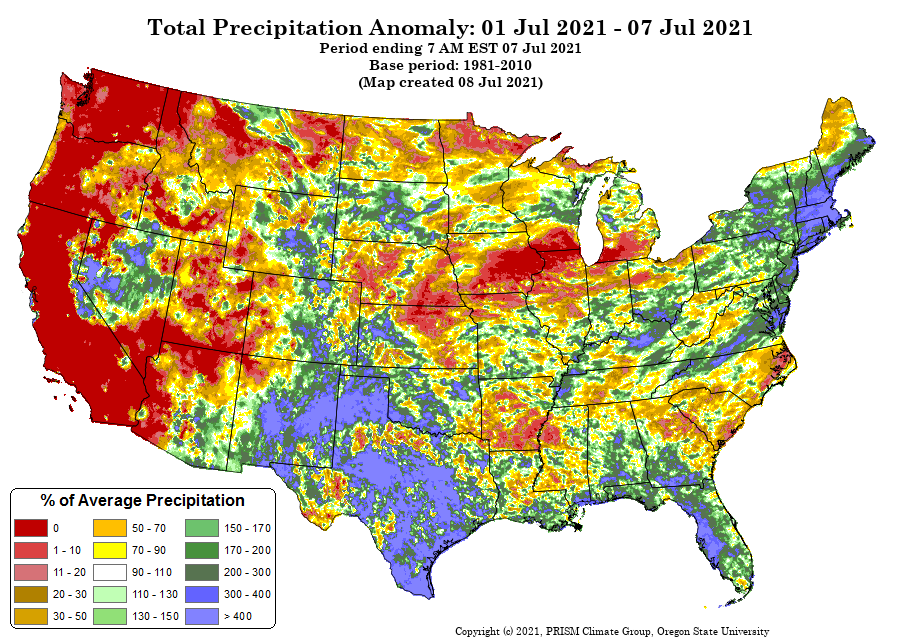
The total precipitation anomaly for the first week of July from PRISM shows that while some portions of Western Colorado have received above average precipitation for the first week of July, conditions have largely been dryer than normal for this time of year, explaining the continued long-term drought. Comparatively, some portions of the eastern half of the state, especially the southeast mountains, have received over 400% of average for the first week of July.
Click Here For Map Overview
Note: The 24-hour, 48-hour and 72-hour total precipitation do not contain bias corrections today due to errors in the CoCoRaHS data. This means there may be underestimations in QPE over the southwest and southeast corners of the state.
