Issue Date: Saturday, June 26, 2021
Issue Time: 9:00 AM MDT
Summary:
As discussed in the Flood Threat Bulletin yesterday, there was plenty of available moisture in the atmosphere on Friday and it materialized as heavy rain across the state. There were lots of heavy rain reports in the Central Mountains, Grand Valley, and Southwest Slope including another 1.75 inches reported in Olathe (who got over 1.5 inches yesterday). Other reports in this region yesterday range between 0.50 – 1.00 inches, all of which will help improve drought conditions in the very dry west.
Along the Northern Mountains, Front Range Mountains, and Urban Corridor flash flood warnings or flood advisories were issued yesterday, especially for small and urban streams after significant rainfall. The Calwood Burn Scar, Cameron Peak Burn Scar, and Hayden Pass Burn Scar we also included in these advisories. While no flooding was reported on the burn scars themselves, there was a report of flooding in Masonville, near Horsetooth Mountain, west of Fort Collins (text below).
Remark: BUCKHORN ROAD SOUTH OF BIG BEAR ROAD CITIZEN REPORTED WATER RUNNING 5 TO 6 INCHES DEEP AND GROWING RAPIDLY.
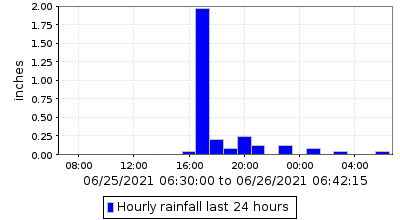
Further south, over 2 inches fell across South Denver and surrounding Metro Area, including 2.91 inches in Parker. A majority of that rainfall, 1.97 inches, fell in just an hour! The time series plot below shows the breakdown of hourly rainfall at Newlin Gulch in Parker. A rainfall rate of 1.97 inches/hour is nearly a 50-year rainfall event in this area.
Urban streams responded to the heavy rain, and there are social media reports of fast-moving creeks and streams overflowing their banks all over Twitter, including the following from Littleton. Additionally, the Big Dry Creek below C-470 at Highlands Ranch and Sand Creek at Mouth near Commerce City are reporting all-time high flow for this day of year.
Heavy rains led to #flooding issues in the Denver metro area on Friday. More rain is in the forecast throughout the weekend. #COwx pic.twitter.com/BInvBo94bk
— WeatherNation (@WeatherNation) June 26, 2021
Last, but certainly not least, we have our first flood reports from the “Report a Flood” tab! Thank you to Jon Person and Evan Mitchell for making the following flood reports yesterday.
“I haven’t seen a flood like this in the Cherry Creek corridor since 2013. The creek is over its banks and is even flooding part of the Happy Canyon bike trail. No damage to report, but significant sediment will likely be deposited by this event. Here are some videos: https://www.youtube.com/watch?v=uOYmpfcEYSM https://www.youtube.com/watch?v=BRZfRPzFzgw” – Jon Pearson, Cherry Creek near Parker, CO
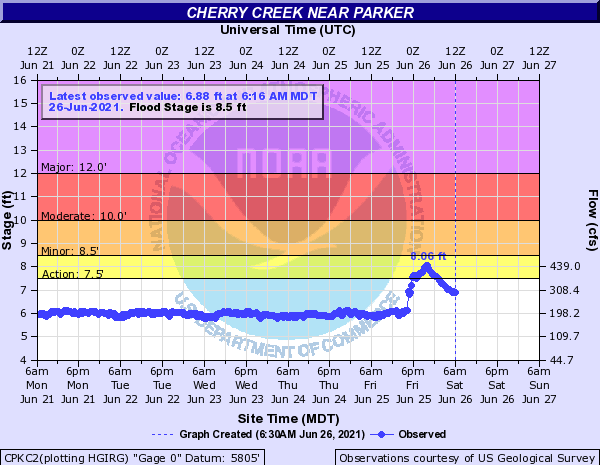
The creek’s response to the heavy rain can also be seen in the hydrograph below, where Cherry Creek near Parker briefly reached “Action” stage overnight.
“soccer field is slowly filling up and drainage gutters on either end are not able to drain it quickly enough. There are several inches of standing water on the field and the creek that runs through govenor grant park is well out over ita banks and is flowing very quickly. The gutters’ drainage holes maybe clogged with debris and may need to be unblocked, but the creek it drains into is still extremely full, it may just not be able to low enough out to drain it.” – Evan Mitchell, west of Littleton
Please continue to utilize the Report a Flood tool if you seen flooding in your area. For rainfall estimates in your area, check out the State Precipitation Map below!
Click Here For Map Overview
