Issue Date: Thursday, June 17, 2021
Issue Time: 9:30 AM MDT
Summary:
Another high temperature record breaking day across the state yesterday, with highs well into the 90s and low 100s. However, there was more scattered precipitation yesterday which brought some brief relief in the form of cooler temperatures if you were lucky enough to be under a shower. High elevation convection began in the early afternoon up and down the Front Range Mountains, Southeast Mountains and San Juan Mountains, and even the Southwest Slope saw some light precipitation. A line of storms trained from southwest to northeast along the Palmer Ridge and Northeast plains, which can be seen in the Max 1-hr precipitation in the State Precipitation Map at the bottom of this post. While 1-hour rainfall rates were as high as 0.25 inches/hour along the line of storms, total precipitation that made it to the ground was ultimately much lighter. Instead, the major threat from the scattered storms was high winds. A 58-mph wind gust from thunderstorms was recorded at the Pueblo Airport yesterday afternoon.
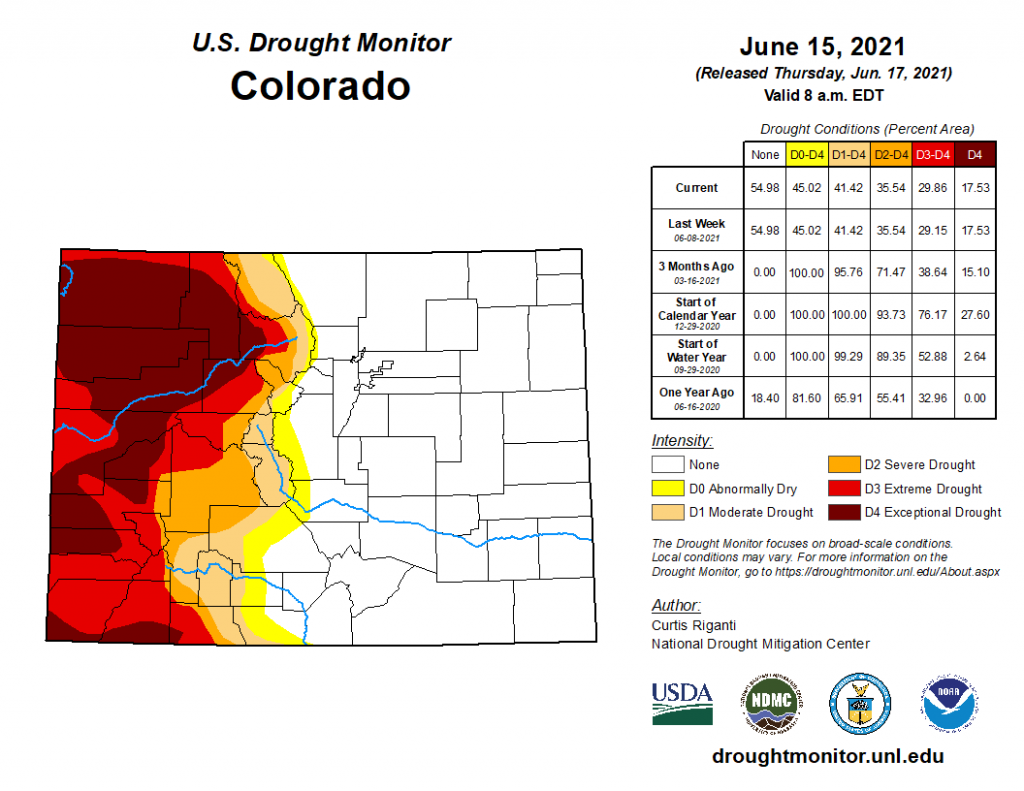
Since it’s Thursday, there’s also an update to the U.S. Drought Monitor, seen below. Drought conditions across Colorado are nearly identical to last week, with the very obvious divide between the eastern and western halves of the state persisting. The hot and dry weather hasn’t provided any relief to the Western Slope, which still has a very large are of D4 exceptional drought.
Flooding was not reported on Wednesday. For rainfall estimates in your area, check out the State Precipitation Map below.
Click Here For Map Overview
