Issue Date: Saturday, May 29, 2021
Issue Time: 10:15 am MDT
Summary
With a transient ridge overhead, sunshine was aplenty for most of Colorado on Friday, along with slightly above normal temperatures. However, in typical Colorado fashion, our unique summer circulation (that is driven strongly by heating over the higher terrain) was able to generate isolated thunderstorms, a few that were severe, over the Raton Ridge, Palmer Ridge and parts of the Northeast Plains.
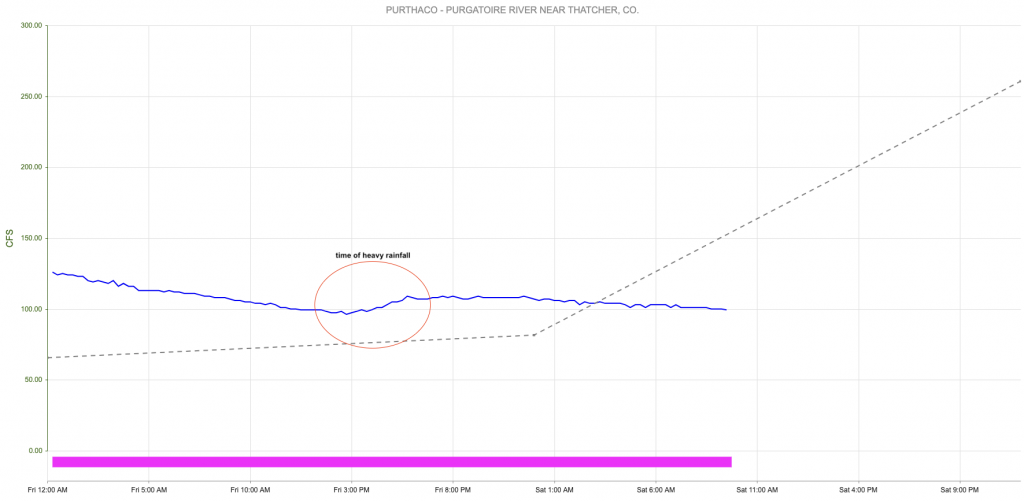
By far the most impressive storms were located over the Raton Ridge, and trekked once again over the Purgatoire River basin. This region is one of the most poorly observed areas of the state, which manifested itself in a huge discrepancy in estimate rainfall rates. Both Stage IV and MRMS guidance estimated that over 2 inches of rainfall occurred in the small Trinchera Creek tributary of the Purgatoire. However, the MetStorm product shown below estimates less than 0.5 inches fell in the 24-hour period (it also estimates max 1-hour intensity of 0.5-1.0 inch; it is common for the 1-hour estimate to be higher than the 24-hour in these situations since the 1-hour is strongly biased towards the more uncertain radar-only estimates). Perhaps the verdict lies in the streamflow. A USGS gage located on the Purgatoire River just downstream of the confluence with Trinchera Creek noted only a ~15 c.f.s. rise in streamflow, shown below. Keep in mind this is the same gauge that rose above 5,000 c.f.s. with the recent rain. With this limited increase in flow yesterday, it is very hard to imagine that anywhere near 2.0 inches of rain actually fell. The most likely outcome was hail contamination causing a spike in the radar estimated rainfall, with actual rainfall likely in the 0.5-1.0 inch range possible.
Click Here For Map Overview
Note: The 24-hour, 48-hour and 72-hour total precipitation do not contain bias corrections today due to errors in the CoCoRaHS data. This means there may be underestimations in QPE over the southwest and southeast corners of the state.

