Issue Date: Tuesday, May 18, 2021
Issue Time: 10:30 am MDT
Summary
Monday, May 17 was an active day up and down the Front Range and Eastern Plains, especially in the Southeast Mountain region west of Pueblo. Heavy rain was reported from Manitou Springs to Walsenberg, including the highest report of 3.59” in 24-hours at a CoCoRaHS station in Rye, CO. For this location, that amount of precipitation amounts to nearly a 22-year Average Recurrence Interval (ARI; or nearly 5% chance of occurring in a given year) – making the second day in a row with precipitation exceeding a 20-year ARI threshold in the state. Overland flooding was also reported in nearby Canon City, Blende, and Beulah, CO – including estimated 3-4 inches of water on roads in Blende.
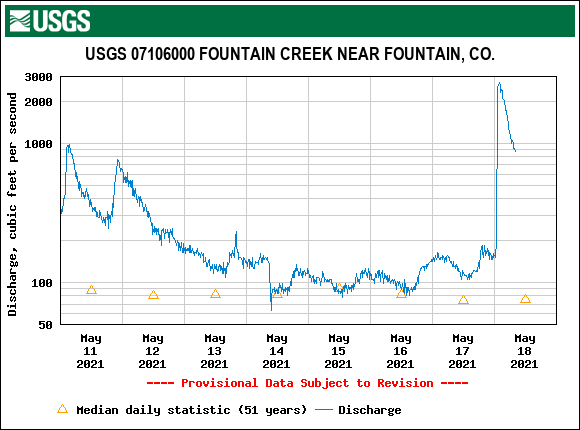
Streamflow at Fountain Creek near Fountain, CO is currently in the 99th percentile, and many gages along the Front Range are in excess of their 95th percentiles. The hydrograph below for Fountain Creek shows that rapid spike in streamflow this morning associated with the heavy rainfall yesterday.
Heavy rain was not isolated to Southern Colorado. Widespread 0.5 inches of precipitation fell up and down the Front Range, with pockets of 1.00 inches or even more. Additionally, Yuma and Kit Carson counties experienced heavy rain and even hail yesterday.
Several fire burn areas received heavy rainfall, and respective NWS offices issued Flash Flood Warnings or Flood Advisories that included portions of the Cameron Peak, East Troublesome, Calwood, Waldo Canyon and Spring Creek burn scars. A local storm report north of the Spring Creek fire reported 2.97 inches of rain in 24-hours, and MetStorm Live grids in the State Precipitation Map below show the entire Spring Creek burn scar received at least 0.5 inches of rain.
72-hour totals on the State Precipitation Map reflect how active the past few days have been, especially in the Southern and Eastern portions of the state. Many counties that were experiencing moderate to severe drought received widespread 0.5 inches of rain, and up to isolated 2+ inches in some locations, which will certainly help with drought conditions. For detailed rainfall estimates in your area for the recent few days, check out our State Precipitation Map below.
Click Here For Map Overview
The map below shows radar-estimated, rainfall gage-adjusted Quantitative Precipitation Estimates (QPE) across Colorado. The map is updated daily during the operational season (May 1 – Sep 30) by 11AM. The following six layers are currently available: 24-hour, 48-hour and 72-hour total precipitation, as well as maximum 1-hour, 2-hour and 6-hour precipitation over the past 24 hour period (to estimate where flash flooding may have occurred). The accumulation ending time is 7AM of the date shown in the bottom right corner. Also shown optionally are vulnerable fire burn areas (post 2012), which are updated throughout the season to include new, vulnerable burn areas. The home button in the top left corner resets the map to the original zoom.
