Issue Date: Monday, May 4, 2021
Issue Time: 9:15 am MDT
Summary
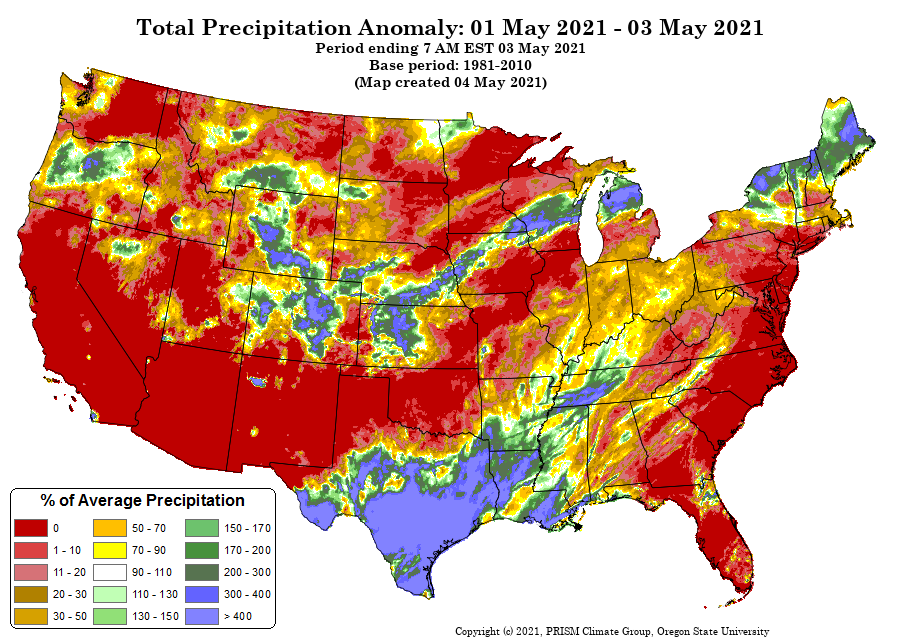
Monday, May 3rd saw widespread, long-duration precipitation across much of the state, associated with a low-pressure system that stalled at the Four-Corners Region for most of the day. Except for the Eastern Plains and portions of the Southwest slope, many regions of Colorado saw above 30-year normal precipitation for the first three days of May, with some areas receiving over 400% of normal precipitation, as seen in the PRISM map below.
Most of yesterday’s precipitation fell as heavy snow in the Northern and Central Mountains, and heavy rain was reported along the Front Range, Urban Corridor, and portions of the Grand Valley. The real snowfall winners were in Larimer and Boulder counties, with some additional heavy snow reports in Park, Jackson, and Clear Creek Counties, seen in the table below. Cameron Pass topped the list, where it picked up 14” of snow on May 3rd!
While heavy precipitation was the main headline of the day, and there was a potential for severe weather, there were no storm-based watches, warnings, or advisories issued yesterday. Flooding was not reported on Monday either. For rainfall estimates in your area, check out our State Precipitation Map below.
| Location | County | Event Type | Magnitude (in.) |
| 9 SE CAMERON PASS | LARIMER | HEAVY SNOW | 14 |
| 4 NNW LONGS PEAK | LARIMER | HEAVY SNOW | 11 |
| 8 NW GLENDEVEY | LARIMER | HEAVY SNOW | 11 |
| 9 SE WESTON PASS | PARK | HEAVY SNOW | 11 |
| 3 SW MEEKER PARK | BOULDER | HEAVY SNOW | 10 |
| 3 SW WARD | BOULDER | HEAVY SNOW | 10 |
| 9 E GLENDEVEY | LARIMER | HEAVY SNOW | 10 |
| 3 NNE MOUNT AUDUBON | BOULDER | HEAVY SNOW | 9 |
| 3 S BRAINARD LAKE | BOULDER | HEAVY SNOW | 9 |
| 4 S LONGS PEAK | BOULDER | HEAVY SNOW | 9 |
| 7 NW RED FEATHER LAKES | LARIMER | HEAVY SNOW | 9 |
| 3 WNW PINGREE PARK | LARIMER | HEAVY SNOW | 8 |
| 1 SW ELDORA | BOULDER | HEAVY SNOW | 7 |
| 1 NE ECHO LAKE | CLEAR CREEK | HEAVY SNOW | 7 |
| 3 WNW ALMA | PARK | HEAVY SNOW | 7 |
| 4 SE MOUNT ZIRKEL | JACKSON | HEAVY SNOW | 6 |
Click Here For Map Overview
The map below shows radar-estimated, rainfall gage-adjusted Quantitative Precipitation Estimates (QPE) across Colorado. The map is updated daily during the operational season (May 1 – Sep 30) by 11AM. The following six layers are currently available: 24-hour, 48-hour and 72-hour total precipitation, as well as maximum 1-hour, 2-hour and 6-hour precipitation over the past 24 hour period (to estimate where flash flooding may have occurred). The accumulation ending time is 7AM of the date shown in the bottom right corner. Also shown optionally are vulnerable fire burn areas (post 2012), which are updated throughout the season to include new, vulnerable burn areas. The home button in the top left corner resets the map to the original zoom.

