Issue Date: Friday, September 4th, 2020
Issue Time: 10:00AM MDT
Summary:
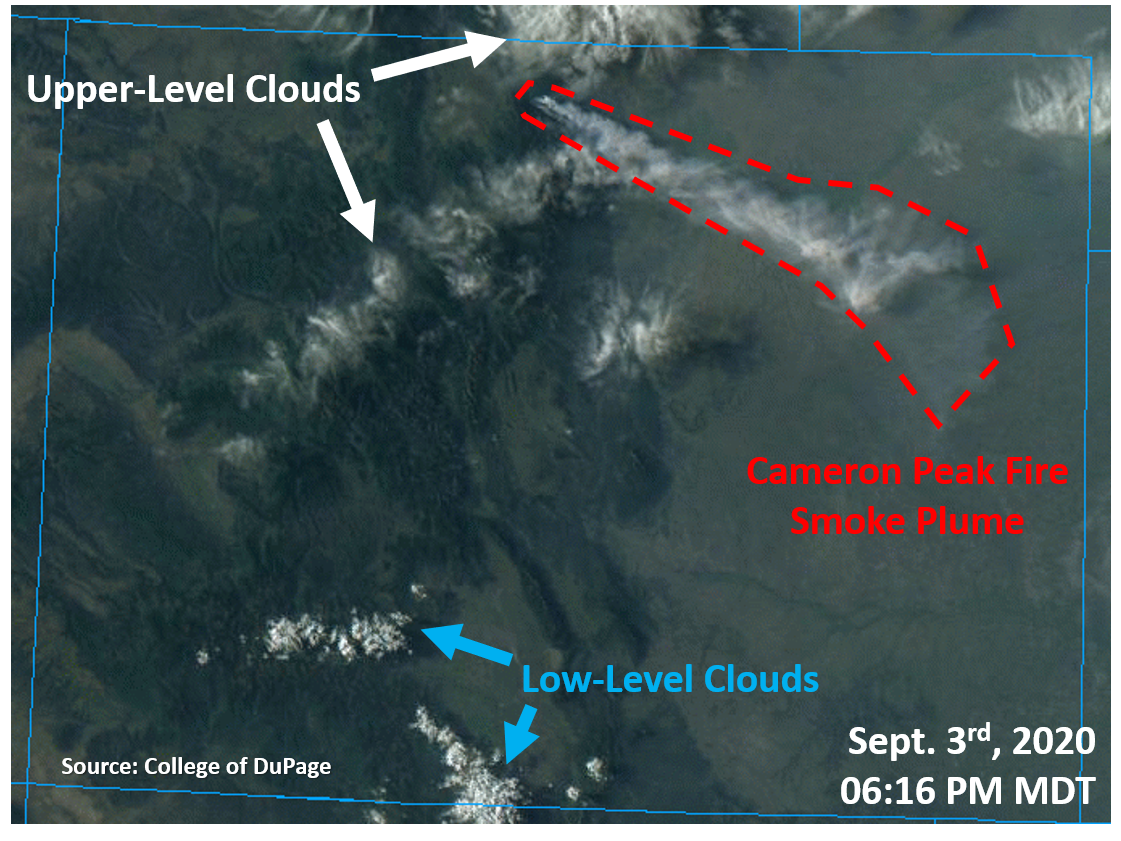
The true-color satellite image below shows it was mainly sunny yesterday afternoon across Colorado. A few upper-level cirrus clouds moved over northern/eastern Colorado, traveling through the northwest flow, but no precipitation was associated with them. A few fair weather cumulus clouds formed over the southern San Juan Mountains yesterday afternoon, but these were not rain producers either. No precipitation was measured across the state yesterday.
The most interesting feature from yesterday is the return of the smoke plume from the Cameron Peak wildfire, which stretched from its source in Larimer County southeast into the plains of Eastern Colorado. This indicates some active fire behavior yesterday. This morning’s updated fire information agrees with this, showing an 866 acre increase in size yesterday and no increase in containment (see below). Continued fire activity and increased smoke is expected today (see the FTB) as well as tomorrow. This includes the William’s Peak fire expanding this weekend with the hot and dry conditions. Fortunately, the Pine Gulch and Grizzly Creek wildfires have some significant containment, so mainly just internal flare-ups are likely for these two fires.
Colorado large wildfire updates (as of 9:15AM on InciWeb):
Pine Gulch – north of Grand Junction: 139,007 acres; 87% contained (6% increased containment)
Grizzly Creek – Glenwood Canyon: 32,464 acres; 83% contained (1% increased containment)
Cameron Peak – Medicine Bow Mountains: 23,903 acres; 6% contained (increased size by 866 acres)
Williams Fork – Arapaho National Forecast: 12,099 acres; 10% contained
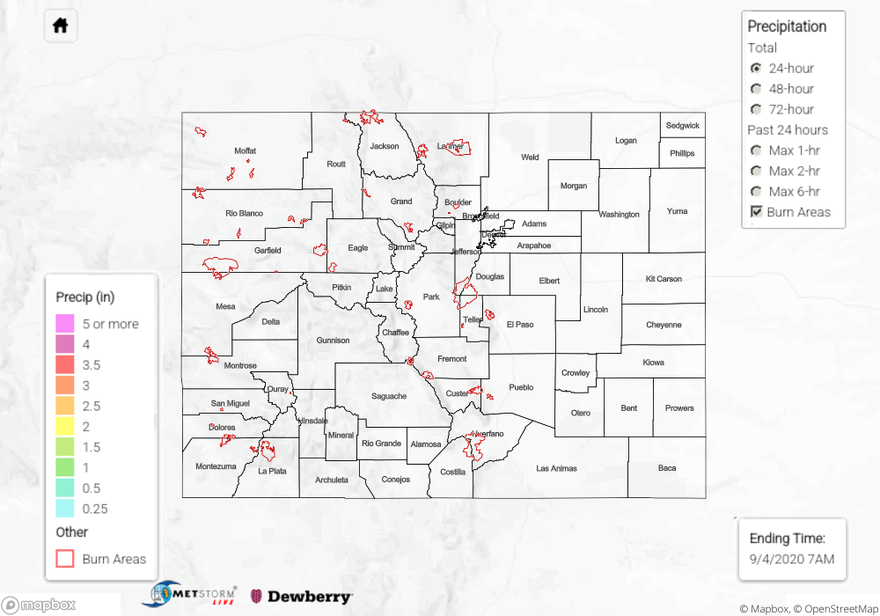
Rain accumulation over the last 24 to 72-hours can be visualized on our State Precipitation Map below.
Click Here For Map Overview