Issue Date: Monday, August 31st, 2020
Issue Time: 9:50AM MDT
Summary:
Scattered storms formed over the mountains yesterday just after 1:30PM with some residual moisture. Generally, precipitation totals east and west over the mountains were under 0.25 inches with slightly higher totals over the Roan Plateau region and southern San Juan Mountains. A USGS gauge near Ouray picked up 0.36 inches, and most SNOTELS further south recorded between 0.30 and 0.40 inches. The main story over western Colorado were the gusty winds, which ranged from 45 mph to 56 mph with the inverted-V soundings.
As storms pushed eastward off the mountains, totals decreased for the most part as well as coverage. In Jefferson County, a weak microburst broke 3-4 inch limbs around 3:20 PM. A gust of 35 mph was found in the area from a MesoWest site. QPE indicates that storm totals over the adjacent plains were under 0.25 inches with CoCoRaHS reports mostly between 0.15 and 0.20 inches. The cold front that dropped through overnight produced gusts up to 55 mph with most stations recording gusts between 35 and 45 mph. Much cooler temperatures were reported behind the front over eastern Colorado, which can be seen into today’s FTB post.
Colorado large wildfire updates (as of 9:45AM on InciWeb):
Pine Gulch – north of Grand Junction: 139,007 acres; 79% contained
Grizzly Creek – Glenwood Canyon: 32,464 acres; 73% contained
Cameron Peak – Medicine Bow Mountains: 23,007 acres; 0% contained
Williams Fork – Arapaho National Forest: 12,097 acres; 10% contained
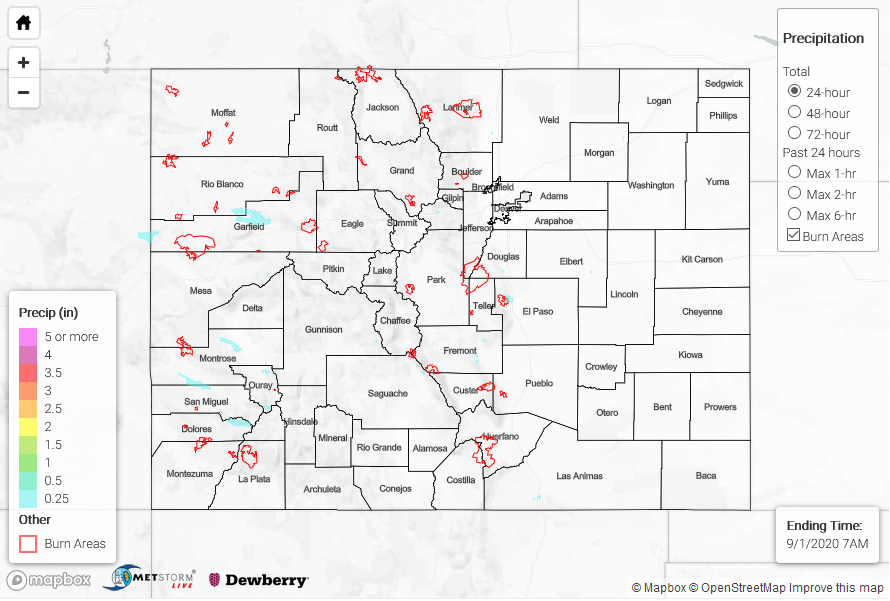
To see precipitation estimates over your neighborhood the last 24 to 72-hours, scroll down to the State Precipitation Map below.
Click Here For Map Overview
Note: The 24-hour, 48-hour and 72-hour total precipitation do not contain bias corrections today due to errors in the CoCoRaHS data. This means there may be underestimations in QPE over the southwest and southeast corners of the state.