Issue Date: Tuesday, August 25th, 2020
Issue Time: 9:50AM MDT
Summary:
It was another hot one yesterday with high temperatures reaching over 100F on the eastern plains and over some of the lower elevations of western Colorado. Eagle reach 93F and Steamboat 91F, so even the mountain towns were toasty. Diurnally driven storms fired over the mountains yesterday just after 1PM due to an increase in mid and upper level moisture. For the most part, storms were pop-like without much mid-level energy, so the rainfall cores were small and fairly weak in intensity. Thankfully, that meant not too much lightning, although I’m sure a couple storms produced a bolt or two. With the large dew point depressions, some 35 mph gusts were also recorded coming from the storms that formed over the Southeast/Wet Mountains.
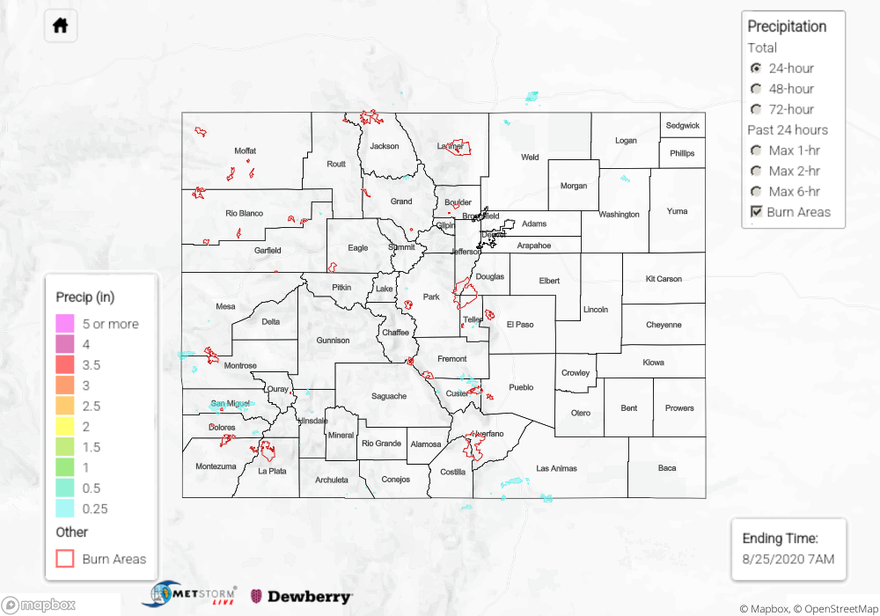
As for observations, CoCoRaHS stations in southern Archuleta and Las Animas counties reported 0.27 and 0.32 inches, respectively. A couple SNOTEL stations in the San Juan Mountains and near Crestone, CO also recorded 0.30 inches. An evening storm popped over the Cheyenne Ridge and tracked into Weld County. QPE picked up a small storm core which produced just over a half inch of rainfall. As expected, flooding was not reported.
Ongoing large fire update (as of 9:45AM on InciWeb):
Pine Gulch – north of Grand Junction: 134,108 acres; 47% contained
Grizzly Creek – Glenwood Canyon: 30,719 acres; 37% contained
Cameron Peak – Medicine Bow Mountains: 20,118 acres; 0% contained
Williams Fork – Arapho National Forecast: 11,266 acres; 5% contained
To see precipitation estimates over your area the last 24-hours, scroll down to the State Precipitation Map below.
Click Here For Map Overview