Issue Date: Wednesday, August 19th, 2020
Issue Time: 10:25AM MDT (Updated 11AM)
Summary:
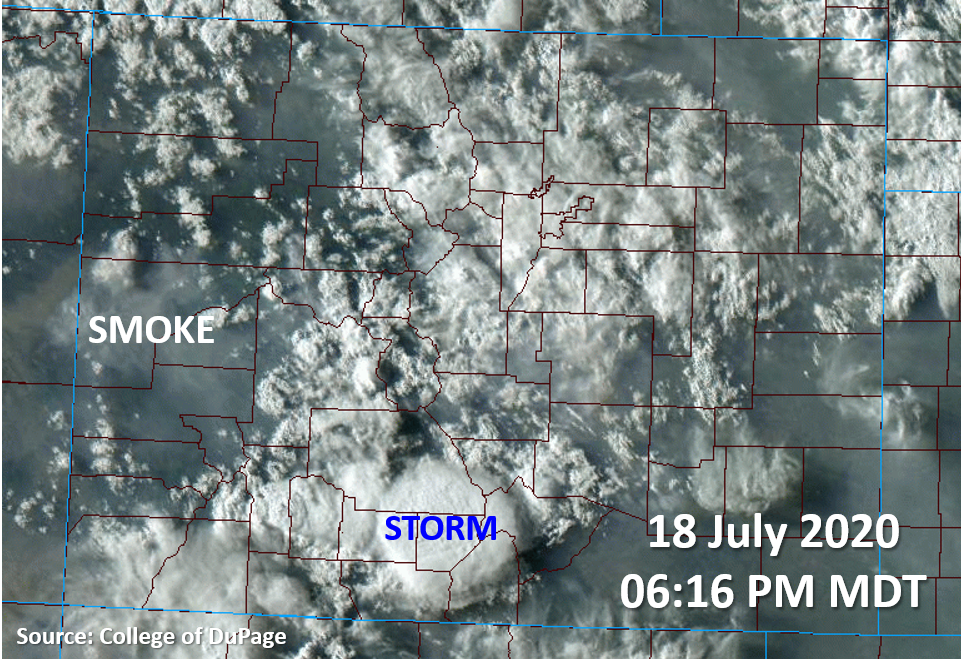
Little rain fell across Colorado yesterday due to limited surface moisture, but there were plenty of clouds and smoke in the air, as evident in the visible satellite image last evening (see below). A few weak storms were again able to fire over the Southeast and San Juan Mountains, like the one over Alamosa County visible by the deeper clouds in the satellite image below. These weak storms dropped up to 0.19 inches of rain over Crestone according to rain gauges. Some additional light showers moved through the Northeast Plains overnight, but they produced less than 0.10 inches of rain. The real story was the heat under this anomalously strong ridge. Highs reached the century mark over the Urban Corridor, portions of the eastern plains, Grand Valley, Pueblo County, and the Southwest/Northwest Slopes. It’s been awhile since we’ve seen 100Fs widespread like this, but not surprising with the strength of the high. Aspen and Crested Butte both hit 90F, and then Crested Butte dropped to 46F overnight. That’s quite the swing!
Increased moisture over the northwestern part of the state last night combined with the Pine Gulch wildfire to create some increased instability, which caused a pyrocumulous cloud and lightning over the fire. NWS Grand Junction has even reported ash falling from this unique cloud! No rain appears to have fallen with this fire-induced convection, but outflow unfortunately has caused additional fire growth along the western edge of the fire.
Wildfire Update:
Pine Gulch – north of Grand Junction: 125,100 acres; 7% contained (grew 37,000 acres overnight; now 2nd largest CO wildfire)
Grizzly Creek – Glenwood Canyon: 29,000 acres; 4% contained
Cameron Peak – Medicine Bow Mountains: 15,738 acres; 0% contained
Williams Fork – Arapaho National Forest: 6,726 acres; 3% contained
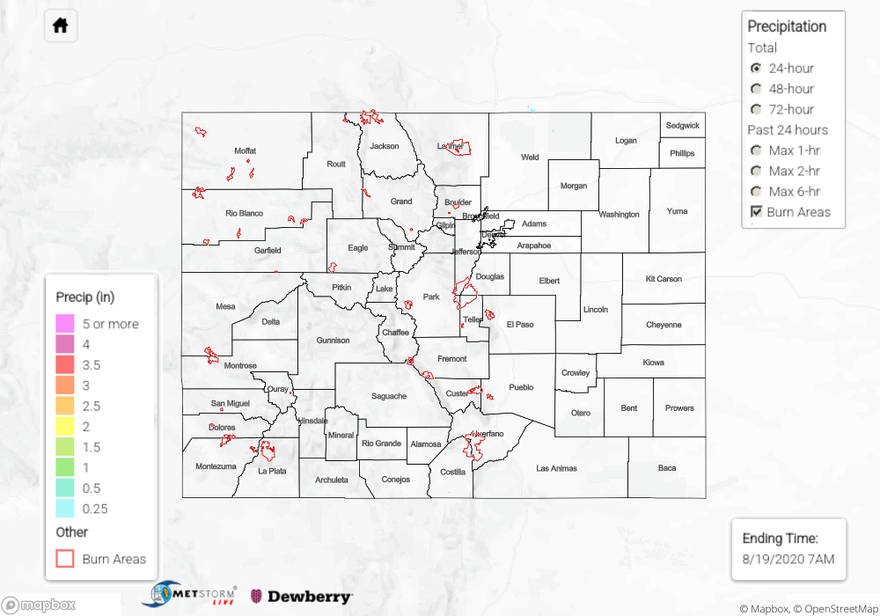
For rainfall estimates in your area over the last 24 to 72-hours, check out our State Precipitation Map below.
Click Here For Map Overview