Issue Date: Monday, August 17th, 2020
Issue Time: 10:20AM MDT
Summary:
Much of the plains of eastern Colorado saw another round of thunderstorms yesterday, which brought heavy downpours, hail up to 2 inches in diameter, and some gusty winds up to 50 mph. QPE indicates some of the heaviest rain fell over northwest Las Animas County. A Weather Underground station near the storm core in Lynn, CO picked up 1.05 inches of rain. The bias-corrected MetStorm Live QPE indicates this storm core rain total was just over 1 inch, which agrees with the rain gauge observation. Storms also rolled through Colorado Springs again, where up to 1.3 inches of rain was reported by a CoCoRaHS observer this morning with no large hail reports. These storms also caused heavy rain reports to be submitted in Colorado Springs, with a report of 1 inch in 40 minutes (~1.5 in/hr rain rates) next to a USGS rain gauge reporting 0.94 inches of rain accumulation. No flooding was reported as of this morning from these heavier rain cores. Take a look at today’s QPE map to see the numerous other plains locations that picked up rain yesterday.
An interesting lone nocturnal storm formed over central Weld County between 1AM and 3AM due to a nocturnal low-level jet transporting moisture westward. This storm dropped around 0.5 inches of rain according to this morning’s rain gauge reports. The storm even prompted a couple of small Flood Advisories to be issued. No flooding was reported as of this morning from this storm.
The four large wildfires burning across Colorado continued to transport smoke south/southeast yesterday, which again made for poor air quality for mountain valley locations and along the Urban Corridor overnight. Below is a summary of the four fires still burning in Colorado (from InciWeb).
Pine Gulch – north of Grand Junction: 85,407 acres; 7% contained
Grizzly Creek – Glenwood Canyon: 25,007 acres; 0% contained
Cameron Peak – Medicine Bow Mountains: 13,305 acres; 0% contained
Williams Fork – Arapaho National Forest: 6,345 acres; 0% contained
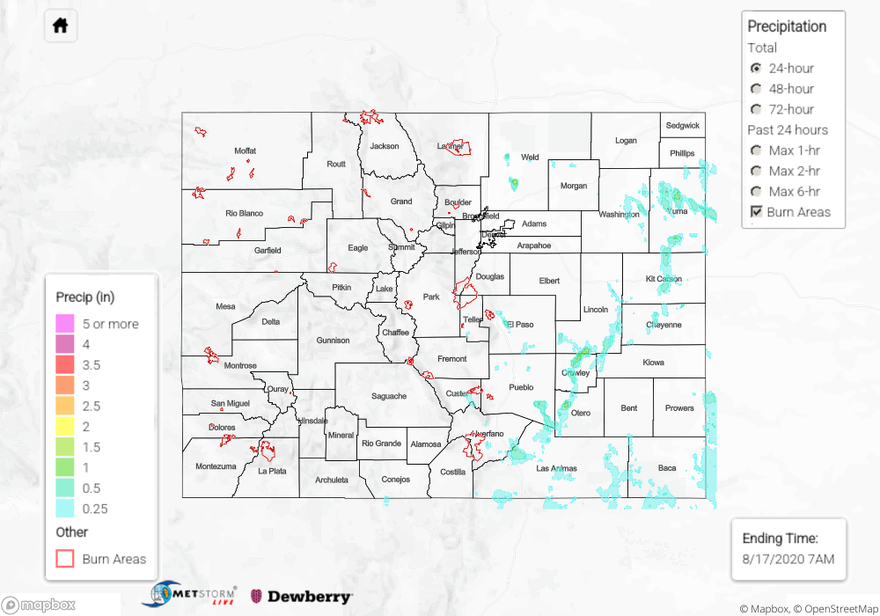
Rain totals over the last 24, 48, and 72-hours can be visualized on the State Precipitation Map below.
Click Here For Map Overview