Issue Date: Tuesday, August 11th, 2020
Issue Time: 9:55AM MDT
Summary:
Fairly quiet on the rainfall front again with the dry air remaining over the majority of the state. A cold front moved through eastern Colorado and helped cool high temperatures off in the area. Some capping prevented widespread storm return, but an increase in low-level moisture behind the front helped produce some storms over the southern I-25 Corridor. Scattered/isolated storms began to develop by early afternoon, but were mostly outflow driven. In Pueblo County a small area of QPE reached 1 inch, but generally storm totals were closer to 0.75 inches in the small storm cores that formed. Storms ended just after sunset as the instability dropped off. Flooding was not reported.
Another fire started in western Colorado yesterday inside of Glenwood Canyon. The Grizzly Creek fire quickly grew with the dry fuels and it had burned 1,300 acres by last night. The canyon continues to stay closed to traffic today. There was a 45 mph wind gust recorded near Meeker, CO Monday evening, and as you can imagine, these brief winds are not helpful for fire containment. The Pine Gulch fire grew to 30,200+ acres, which has cause very poor air quality for the area. If you want to track the smoke from the fires, you can use this tool from AirNow: Click Me
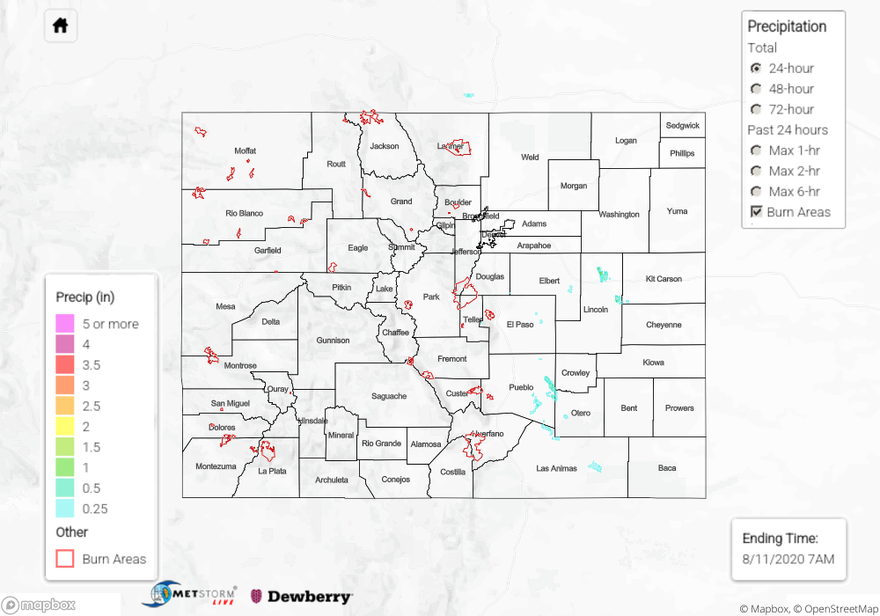
To see precipitation estimates over your neighborhood the last 72-hours, scroll down to the State Precipitation Map below. There continues to be an error in QPE over Lincoln County, so please disregard the rainfall totals in that area.
Click Here For Map Overview