Issue Date: Monday, August 10th, 2020
Issue Time: 10:40AM MDT
Summary:
Once again, a few storms were able to track through the eastern and southeastern border counties of Colorado yesterday, but rain totals remained below 0.5 inches according to the QPE analysis. The highest CoCoRaHS rain gauge report this morning is 0.03 inches in southern Prowers County. A Weather Underground station reported 0.06 inches of rain in northeastern Cheyenne County. Unfortunately, rain gauge locations are few and far between along the eastern plains, so the higher QPE totals cannot be verified. Note that the high QPE totals over eastern Lincoln and southwestern Kit Carson counties are likely ground contamination from radar because storms did not track over this area yesterday. Storms over Kit Carson County produced wind gusts up to 68 mph before tracking east into Kansas. No flooding was reported with the storms over the eastern plains.
Yesterday was mainly dry across the state as temperatures soared, especially over the plains of eastern Colorado. Denver tied a daily high temperature record of 98F. Most locations across the plains reached the upper 90Fs, with a few locations hitting 100F. The western half of the state saw warm temperatures in the mid-90Fs for low-elevation valleys, but temperatures remained well below records. Unfortunately, this heat and dry air allowed the Pine Gulch Fire to continue to burn, which is now up to 25,000 acres. Low humidity will allow continued fire growth today. Smoke from the Pine Gulch Fire has also been affecting air quality in the Grand Valley, central and northern mountain valleys, as well as the Urban Corridor, especially overnight when smoke gets trapped in the shallow nocturnal boundary layer. Expect this smoke to affect similar areas today and tonight.
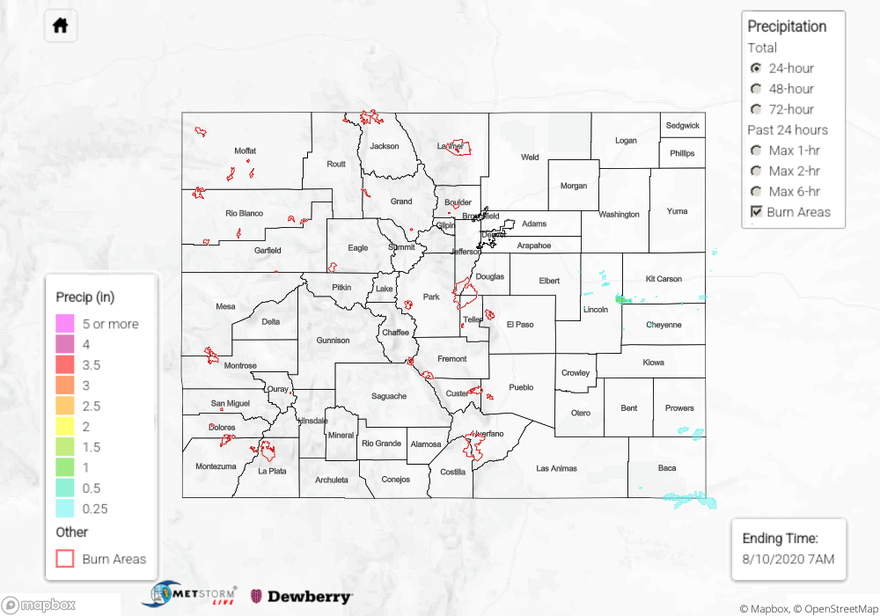
To see how much rain your area received over the last 24, 48, and 72 hours, check out our State Precipitation Map below.
Click Here For Map Overview