Issue Date: Sunday, August 9th, 2020
Issue Time: 10:45AM MDT
Summary:
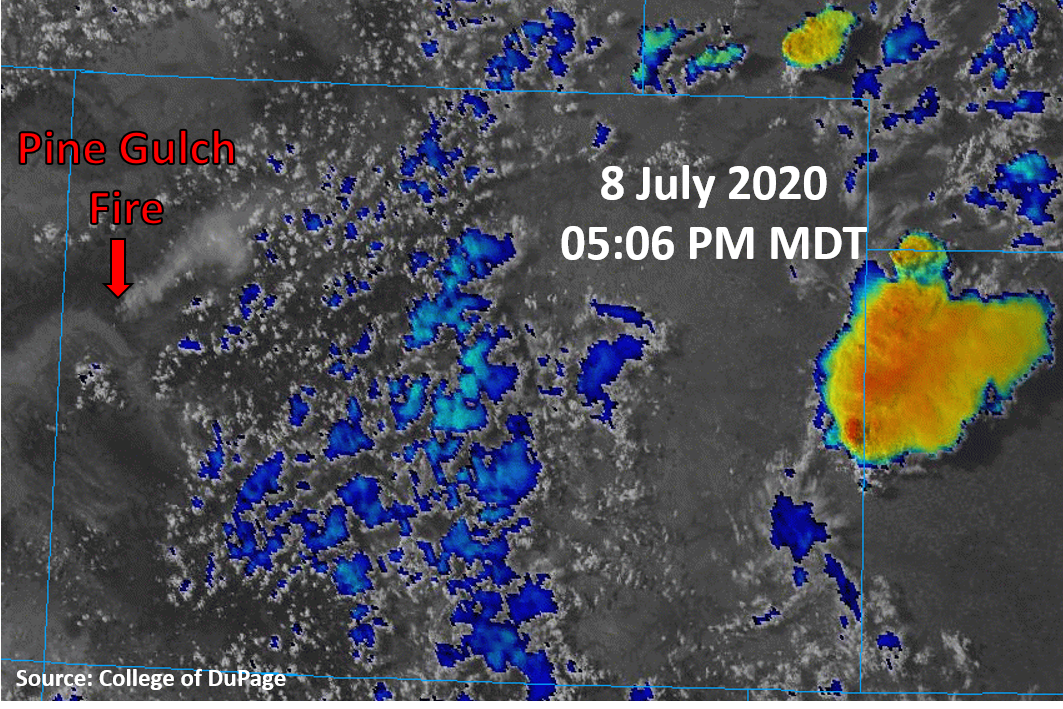
Storms mainly avoided Colorado yesterday, but a couple of storms fired over Cheyenne County along the eastern border before moving into Kansas. These storms are visible at 5PM yesterday on the visible + IR “sandwich” satellite image with cold cloud-tops (yellow/red colors on image below). These storms brought the only significant rainfall to the state, with rain gauges reporting up to 0.60 inches of accumulation. QPE indicates up to 2 inches of rain fell in the strongest storm core near the Kansas border, but limited gauges in the area make this hard to verify. Clouds and showers developed over the mountains (blue on satellite image below), but little to no rainfall made it to the ground as the highest CoCoRaHS rain gauge totals were 0.01 inch.
The Pine Gulch Fire continued to burn in western Colorado as its plume of smoke was visible on satellite imagery (see below), which continued to flow northeast into the Northern Mountains. An updated mapping of the fire indicates over 21,000 acres have been burned, which is only 7% contained as of last night. Evacuation and pre-evacuation warnings were sent out by emergency managers yesterday. If you live near the area, stay up to date on this fire. A Facebook page has been created for disseminating fire-related updates and evacuation information, which can be found here: https://www.facebook.com/PineGulchFireCO
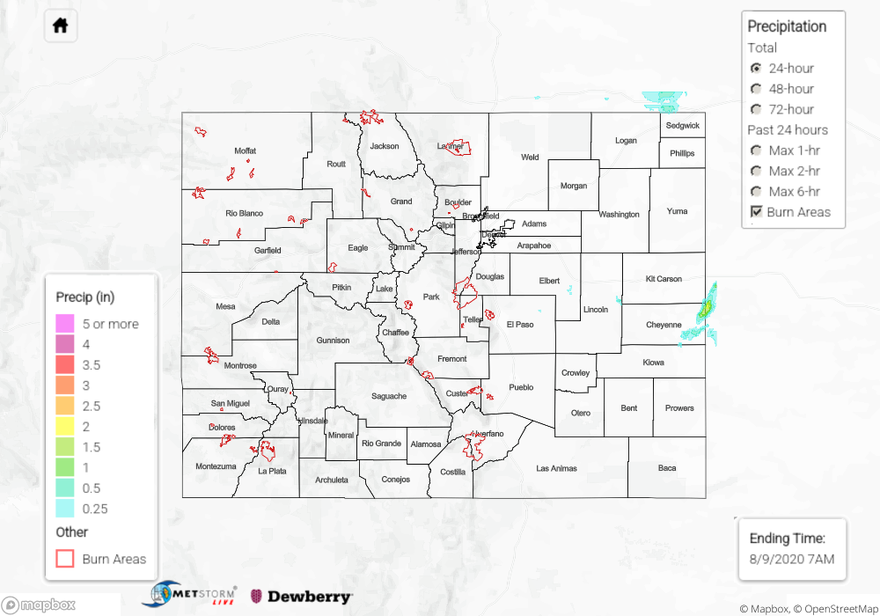
For rainfall estimates in your area over the last 24, 48, and 72 hours, check out our State Precipitation Map below.
Click Here For Map Overview