Issue Date: Sunday, July 26th, 2020
Issue Time: 10:45AM MDT
Summary:
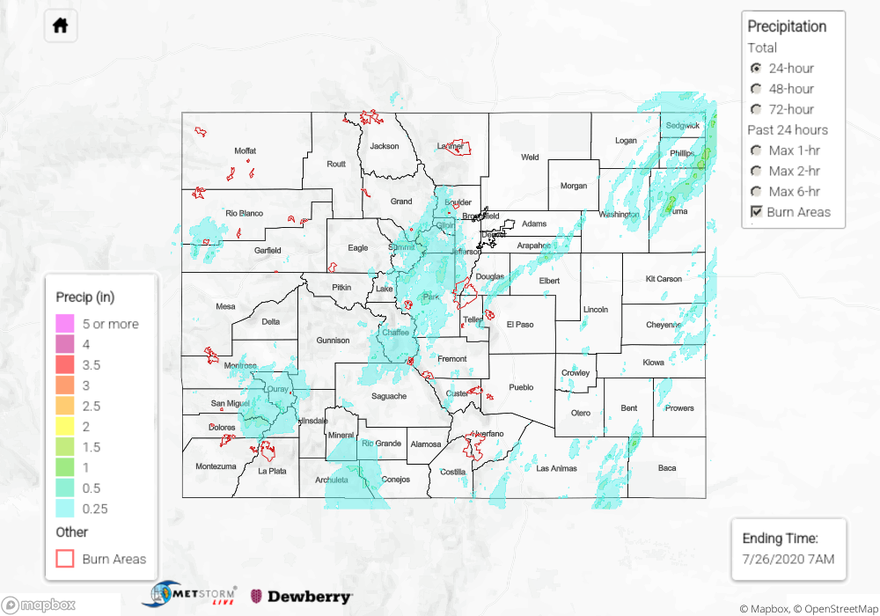
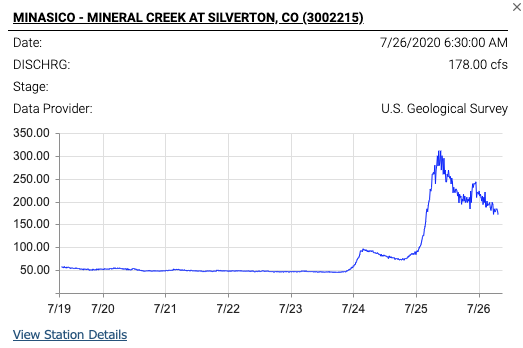
Multiple rounds of heavy rainfall occurred during the afternoon and evening hours mainly across Colorado’s higher terrain on Saturday. From a climatological perspective, we are approaching the peak of the monsoon season, so this rainfall occurred right “on time”. The highest rainfall amounts occurred over the western part of the San Juan Mountains. Widespread amounts over 1 inch fell across Ouray, San Miguel, Dolores, San Juan, Montezuma and La Plata counties. Observations in the higher terrain of this area are quite sparse, but it is likely that intensities of 0.5 inches in 30 minutes or so were common. One report near Durango showed over 1 inch of rain fell in less than 30 minutes. Many areas received multiple rounds of heavy rainfall, which combined with the antecedent wet soils to produce more efficient runoff. The NWS issued four Flood Advisories in the afternoon and evening over the higher terrain of the San Juans. The Durango Herald reported that several hikers in Silverton had to be rescued due to high water and County Road 7 was closed beyond Ice Lake. The hydrograph from Mineral Creek in Silver, below, shows quite a sharp increase in flow yesterday afternoon, and even higher spikes were likely in the upstream areas. The Dolores River also showed a marked increase in flow, but has thus far stayed below flood stage.
Elsewhere, isolated heavy rainfall occurred over the Central Mountains and farther east as well, with a few locations receiving over 1 inch that likely came from multiple rounds of heavy rainfall.
To view the latest hydrologic conditions across Colorado, check out the DWR site below:
https://dwr.state.co.us/tools/stations
To see precipitation estimates over your area the last 24 to 72-hours, scroll down to the State Precipitation Map below.
Click Here For Map Overview