Issue Date: Monday, July 20th, 2020
Issue Time: 10:40AM MDT
Summary:
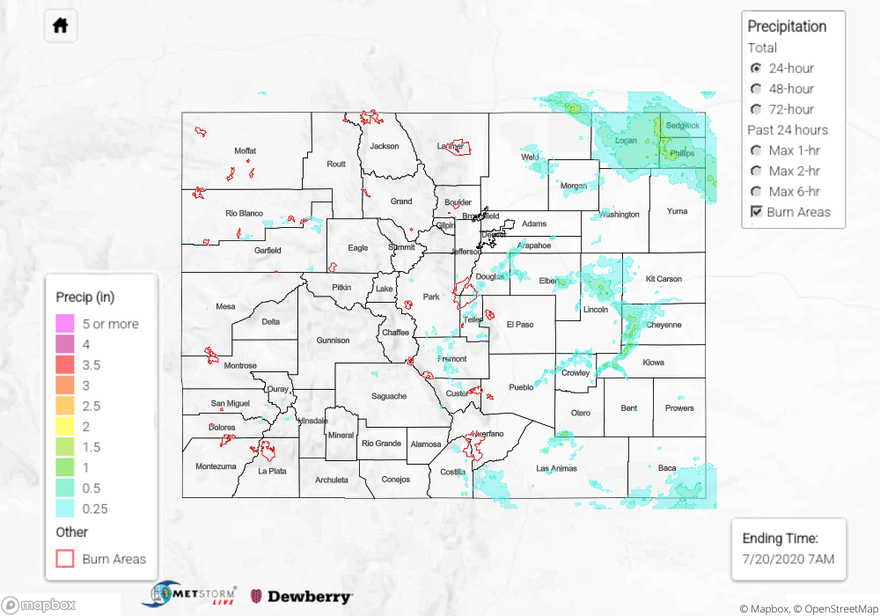
A group of severe thunderstorms swept through northeast Colorado yesterday, bringing heavy rain, strong winds, hail, and even a weak tornado in Phillips County. An impressive 1.83 inches of rain was reported by a CoCoRaHS observer just north of Sterling in northeastern Colorado, and a nearby CoAgMET gage also picked up 1.68 inches of rain, so QPE in this area appears to be underestimated. This heavy rainfall was associated with a large severe thunderstorm that dropped 1-inch hail and produced a 71 mph wind gust over the area. Some crop and power pole damage was reported from this gust near the town of Iliff.
The Palmer Ridge also picked up some decent rainfall as storms fired over the southern Front Range and tracked east. Several CoCoRaHS rain reports and ALERT gages exceeded 0.40 inches (up to 0.44”) over the southern Urban Corridor and Palmer Ridge. The QPE map indicates that storms may have dropped a little over an inch of rain over portions of Lincoln, Cheyenne, and Kiowa counties. One of these storms prompted a Flood Advisory from NWS Boulder over Lincoln County from 4-7 PM MDT.
Storms back over the high country produced more wind than rainfall. A 58 mph gust was picked up at a Basalt mesonet site, and QPE was estimated around 0.25 inches for storms near the area. A storm tracked over the Decker burn scar, which prompted a Flash Flood Warning as radar indicated over 0.3” of rain had fallen. NWS ASOS stations near the area only picked up to 0.07” of rain, so this storm was very isolated over the higher terrain. Additionally, radar-derived QPE likely under-estimated sub-cloud evaporation. As of this morning, no flooding was reported.
For 24-hour to 72-hour rainfall estimates in your area, check out our State Precipitation Map below.
Click Here For Map Overview