Issue Date: Monday, September 23rd, 2019
Issue Time: 9:40AM MDT
Summary:
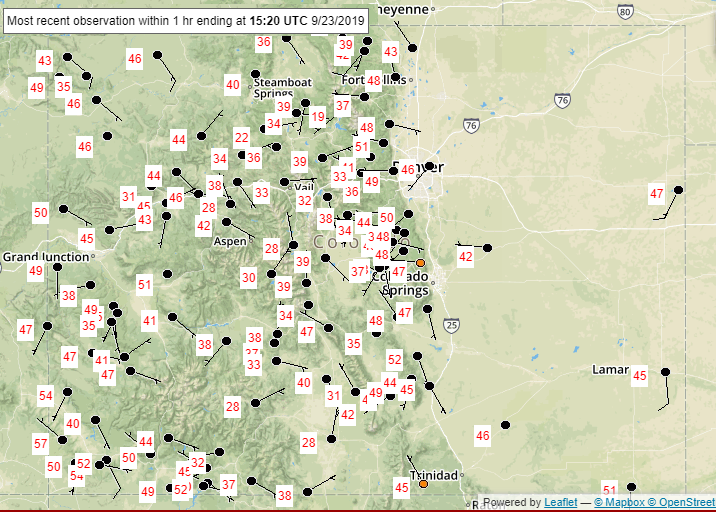
Rain-free day for the state on Sunday as high pressure began to build over the state and a drier air mass moved overhead. PW dropped off as much as 0.3 inches over the Northeast Plains after overnight rainfall on Saturday. Below are overnight low temperatures from the RAWS network (source: MesoWest). Not quite as cool as Saturday night, but still some chilly temperatures to wake up to. High temperatures on Sunday were actually 5-8°F warmer than Saturday minus small areas over of the northern Northeast Plains and central Southeast Plains. The largest warm up was over the Front Range and Southeast Mountains. Overall, calm with clear skies, so hopefully you were able to get out and enjoy the weather.
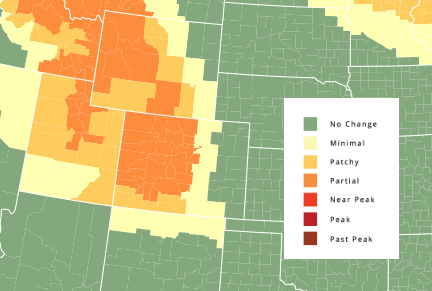
Autumn colors are expected to peak around the usual time (early to mid) October. I may lean a little closer towards mid-October due to the above average temperatures, especially in regards to overnight lows. According to the map below (produced by the Smoky Mountains website) there is already partial peaking occurring for most of the high terrains. An above average year (colors) is predicted due to the wet spring and heavy snowfall last winter. It will be interesting to see how the dry conditions over the last couple of months affect the colors over western Colorado. You can follow along here for conditions around the lower 48 states: https://smokymountains.com/fall-foliage-map
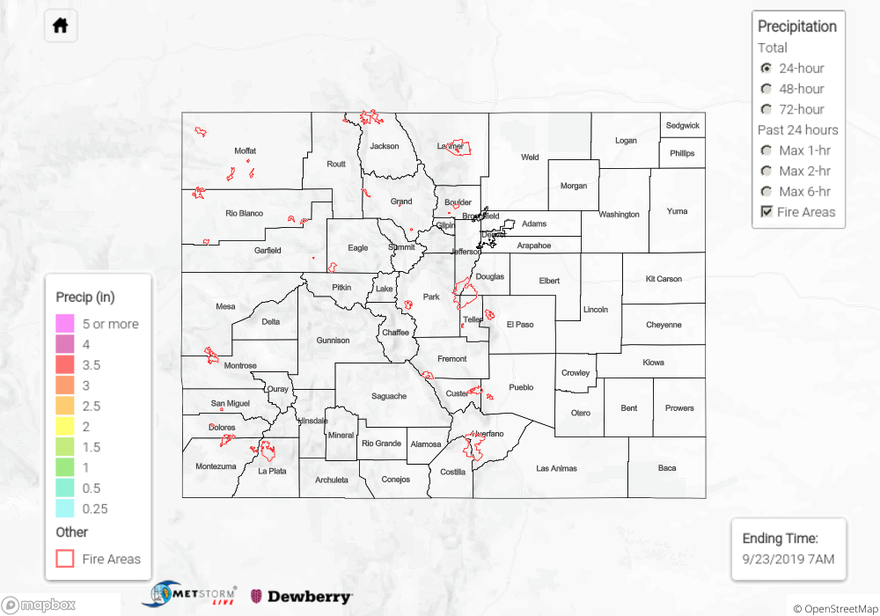
To see estimated precipitation totals over your area the last 72-hours, scroll down to the State Precipitation Map below.
Click Here For Map Overview
Note: The 24-hour, 48-hour and 72-hour total precipitation do not contain bias corrections today due to errors in the CoCoRaHS data. This means there may be underestimations in QPE over the southwest and southeast corners of the state.