Issue Date: Friday, September 20th, 2019
Issue Time: 9:45AM MDT
Summary:
Quiet rainfall day yesterday with a drier air mass in place and southwest/south flow over the state aloft. Over the mountains, the most measurable rainfall was over the San Juan Mountains during the evening and overnight. A shortwave moved through the flow and helped initiate the late night showers. Not much instability, so showers were more gradual in nature. Quick storm movement with the approaching trough also helped keep totals lower. Strong surface winds and impressive gusts cause elevated fire danger yesterday over most of western Colorado and some pockets over the higher terrains. Gusts just above 40 mph were recorded over the Northwest Slope.
As far as rainfall totals, a USGS gage near Durango at the Animas River recorded 0.11 inches for the 24-hour period. Storms also produced up to quarter sized hail. Totals were slightly higher over the San Juan National Forest, but under 0.25 inches. The San Luis Valley also got some light rainfall with another passing shortwave. A CoCoRaHS station near Fort Garland recorded 0.06 inches. Additional storms formed along a convergence boundary over the far Southeast Plains. The strongest storm of the day was over Prowers County where MetStorm estimates up to 1.25 inches fell. A CoCoRaHS station 15 miles NNE of Holly recorded 0.78 inches with this storm. Large hail (1.5 inch in diameter) and damaging winds also accompanied this storm with several branches down in Holly.
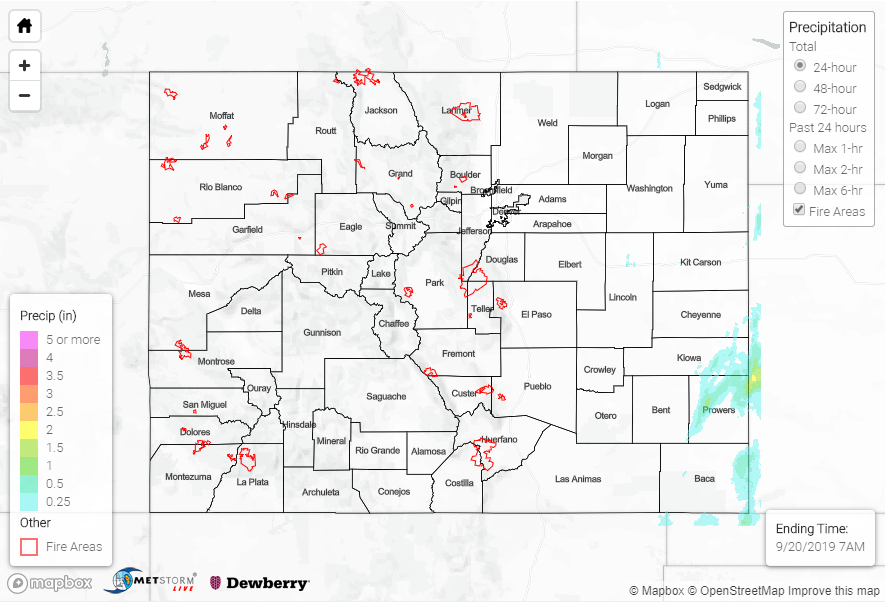
To see estimated precipitation totals over your neighborhood yesterday, scroll down to the State Precipitation Map below.
Click Here For Map Overview
Note: The 24-hour, 48-hour and 72-hour total precipitation do not contain bias corrections today due to errors in the CoCoRaHS data. This means there may be underestimations in QPE over the southwest and southeast corners of the state.