Issue Date: Wednesday, September 18th, 2019
Issue Time: 9:10AM MDT
Summary:
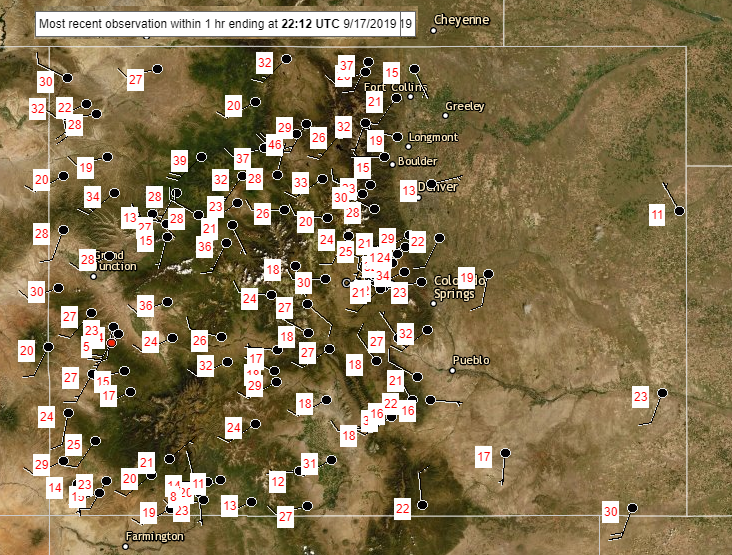
Strong surface winds were experienced yesterday with the jet over western Colorado and high-based thunderstorms in the area. Over northwest Colorado, wind gusts (associated with thunderstorms) between 45 and 60 mph were recorded from Meeker to Rifle. Below are the max 1-hour wind gusts from about 4PM MDT on Tuesday at various RAWS sites (source: MesoWest). A new fire was started about 10 miles northwest of Craig. The approximate size is estimated at 30 acres. The McNey and Decker Fire also continue to burn, along with the Hunt and Middle Mamm fires.
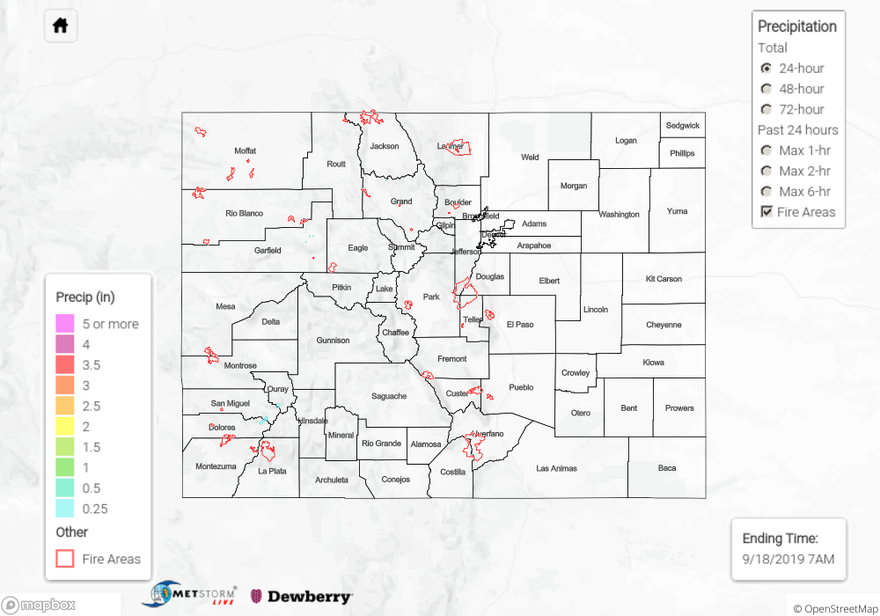
As far as rainfall totals, light accumulations (under 0.25 inches) were widespread over the western high terrains with a couple areas receiving just under 0.5 inches. The USGS site at the Animas River in Silverton recorded 0.4 inches. With slightly less moisture to the north, the Craig NWS ASOS site recorded 0.13 inches. Isolated, light showers were also present over the far eastern plains, but totals were under 0.25 inches, so they are not shown below.
Flooding was not reported on Tuesday. To see estimated precipitation totals over your area the last 48 to 72-hours, scroll down to the State Precipitation Map below.
Click Here For Map Overview