Issue Date: Tuesday, September 17th, 2019
Issue Time: 9:55AM MDT
Summary:
More rain for western Colorado yesterday with a little rain for eastern mountains and adjacent plains as well. Rain was rather gradual, so flooding issues weren’t a huge worry. Overall, rain totals were generally less than 0.25 inches, so there isn’t a lot shown on the map below. The 416 burn area avoided rainfall all together (according to gages in the area), although some higher totals were just to the south. The Durango area got another 0.56 inches with Delta, CO also recording 0.5 inches and small hail. The most impressive total was again over Archuleta County where a spotter in Pagosa Springs recorded 1.9 inches for the 24-hour period. Based on other stations in the area, thinking this may be a 2-day total and a little high. A CoCoRaHS station at the Southern Ute Reservation also recorded a half inch. Back to the west, a storm over Yuma County recorded up to 0.25 inches. A couple light showers also occurred over the southern Urban Corridor/Palmer Ridge area, but totals were 0.1 inches or lower.
There’s been quite a bit of rain over the southwest corner of the state the last couple of days, which is helpful for the drought conditions. MRMS indicates between 0.25 and 0.5 inches for the high elevations in that area, and totals under 0.1 inches for the lower elevations. Using the Mountain Mapper correction, west-central Archuleta County recorded just under 1 inch.
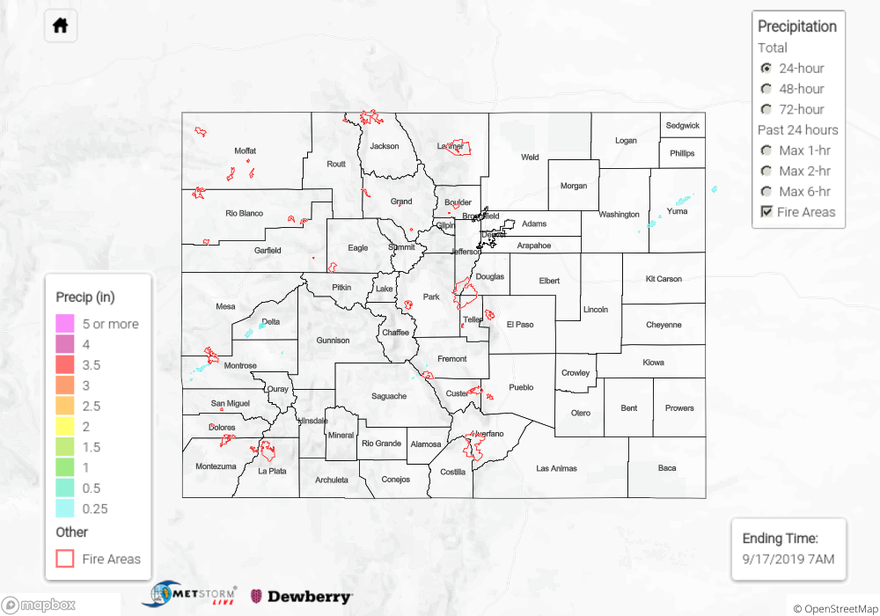
To see estimated precipitation totals over your area yesterday, scroll down to the State Precipitation Map below.
Click Here For Map Overview