Issue Date: Monday, September 16th, 2019
Issue Time: 10AM MDT
Summary:
A subtropical shortwave trough moved northeastward from Arizona and New Mexico yesterday, which helped produce widespread showers to the southwest corner of the state with PW values increasing. Showers were still ongoing as of this morning, which lead to some impressive accumulations. A few CoCoRaHS stations in Archuleta County (east of Pagosa Springs) recorded around 1.3 inches for the 24-hour period. Near the 416 burn area, 0.3 inches of rain fell, and Oxford, CO (just southeast of Durango) received 0.57 inches for the day. Even Alamosa got in on the action and recorded around a quarter of an inch for the 24-hour period. Along the valley edges, the Great Sand Dunes received between 0.4 and 0.5 inches due to storms favoring the southwest facing slopes with southeasterly flow driving the storm’s direction. Several SNOTEL stations in the area recorded 0.4 inches for Sunday. Fortunately, rainfall was gradual enough and soils were dry enough that no flooding was reported as of this morning.
As a reminder, it has been very dry and hot over the state the last couple of weeks, which has helped dry out vegetation. This has increased fire danger despite relatively quiet surface winds (no Red Flag Warnings have been issued). There has been a large increase in fires reported over the last couple of weeks (relative to the quiet season), so please use caution with any activities that can spark a flame. As of this morning, there have been 7 new fires started in the last 30 hours with 54 ongoing fires over the last 10 days. To keep yourself in the loop about ongoing fires you can visit the Rocky Mountain Area Coordination Center or InciWeb.
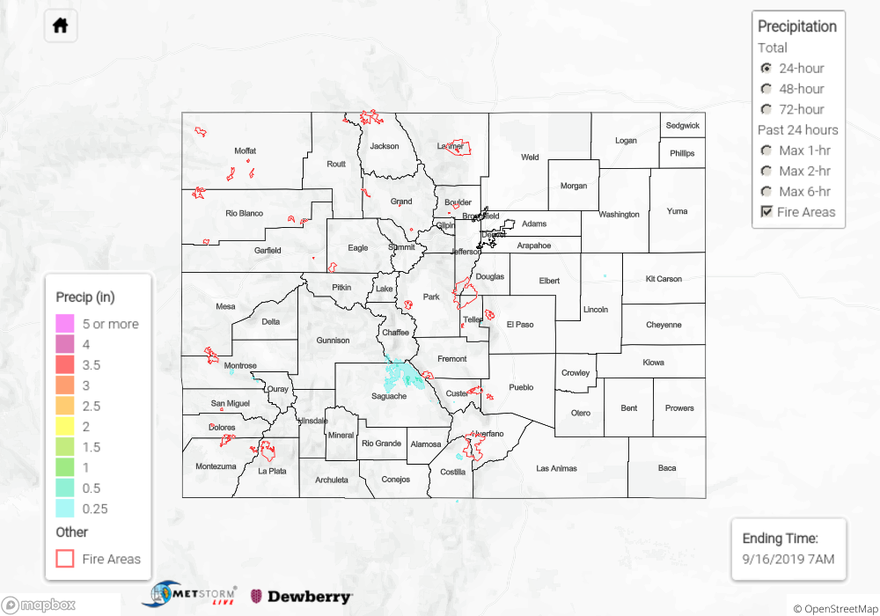
To see estimated precipitation totals over your neighborhood on Sunday, scroll down to the State Precipitation Map below.
Click Here For Map Overview