Issue Date: Sunday, August 25th, 2019
Issue Time: 9:25AM MDT
Summary:
Afternoon cloud cover with some light sprinkles were all the passing shortwave and daytime diurnal pattern could muster for rainfall over the mountains yesterday. Better moisture over the Southeast Plains (Baca, Prowers and eastern Las Animas Counties) allowed for the only measurable rainfall of the day. MetStorm estimates just under 0.5 inches of rain fell with these systems with no observations in the area having significant amounts of precipitation recorded. Additionally, 1 inch diameter hail was also reported near Pritchett, CO associated with the severe thunderstorm. At 10:15AM yesterday, NWS Goodland issued an Areal Flood Warning for Cheyenne County with Cheyenne Creek running over County Road 9 at Wild Horse from Friday’s rainfall. An additional heavy rainfall report of 5.75 inches was submitted near Wild Horse after the SPM was published yesterday. The Areal Flood Warning was not renewed, so it’s probably safe to assume the high water has retreated.
High temperatures reached 97°F over Grand Junction and 95°F over Trinidad, which are much warmer than climatology. The Denver Metro region was right around 90°F with the valleys in the mountains nearing 80°F. Dense fog formed over the eastern plains last night, but ASOS stations are already showing the fog thinning over the last hour or so.
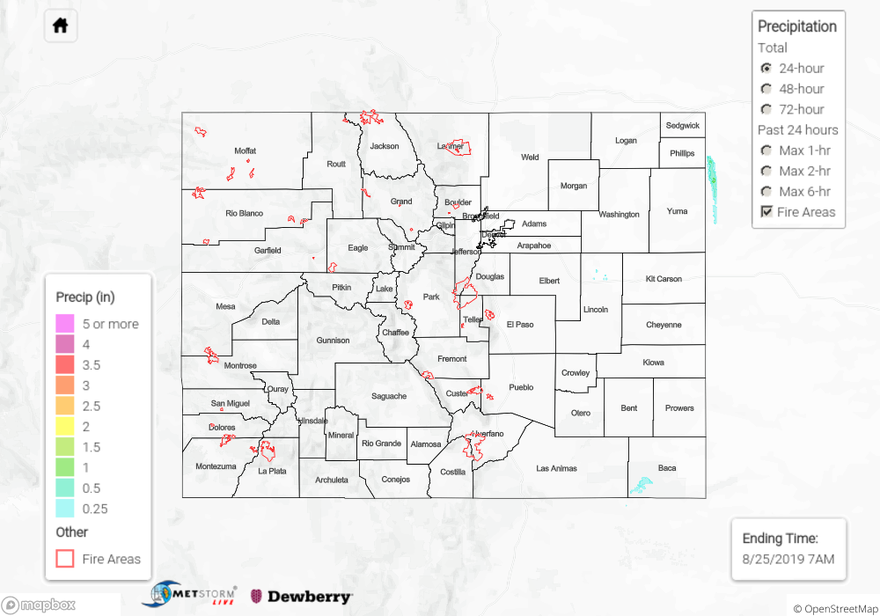
To see estimated precipitation totals over your neighborhood over the last 48-hours, scroll down the State Precipitation Map below.
Click Here For Map Overview