Issue Date: Thursday, August 8, 2019
Issue Time: 10:40AM MDT
Summary:
Another day of heavy rainfall and severe thunderstorms over the far eastern plains. The dryline set up farther to the southwest than originally forecast, which allowed for severe thunderstorms to form over the Southeast Plains. Most storms also initiated later than expected, but once a few storms were able to generate, gust fronts did the rest of the work spreading out storm coverage. There were a few isolated reports of hail over Cheyenne, Elbert, Kiowa Counties, with golf ball sized hail reported over Cheyenne Wells! Heavy rainfall of 1.53 inches was measured over a two hour period near Burlington in Kit Carson County, with an additional report of 2.2 inches near Stratton. The highest radar derived measurements for the day occurred in Kiowa and Washington Counties, measuring up to 3 inches in isolated areas. Surface reports from CoCoRaHS stations reported up to 2.24 inches of rain in Morgan County, giving the area the highest surface measurement of the day. A few brief storms over the Urban Corridor measured up to 0.47 inches at a UDFCD Alert gage at the Englewood Dam in Arapahoe County.
Back to the west storms lasted throughout the day, but lack of instability kept storms from producing brief periods of heavy rainfall. The San Juan Mountains had the highest accumulations for the day, with a CoCoRaHS station in northern La Plata County near the 416 burn area measuring up to 0.51 inches. However, no flooding was reported over the burn area. A RAWS station near Buckles in southern Conejos County reported up to 0.38 inches of rain over a 3 hour period. Surface reports throughout the high country indicated measurable precipitation, however most reports were of less than 0.11 inches over 24 hours. A Flash Flood warning was issued by the NWS over the Spring Creek burn area, however no flooding was reported.
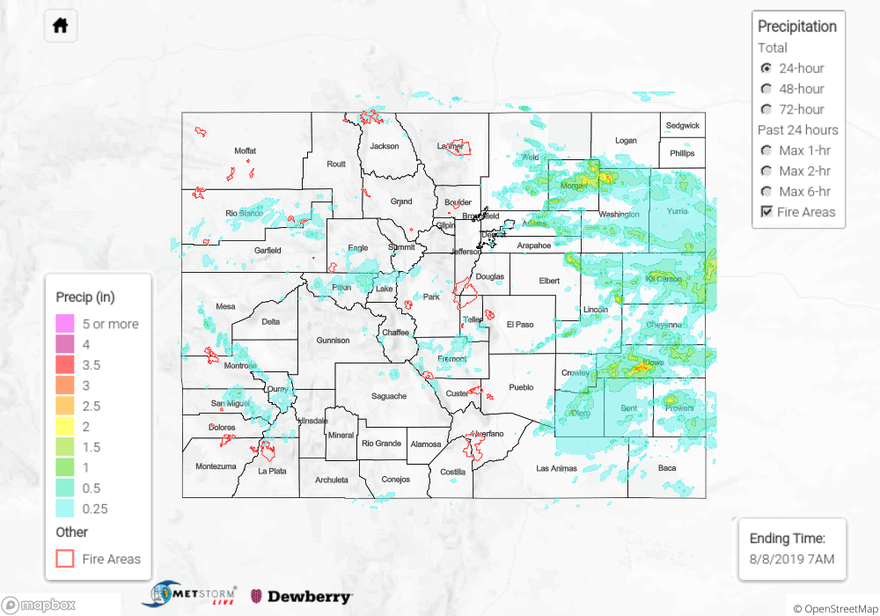
For a look at precipitation over your area, please see the State Precipitation Map below.
Click Here For Map Overview