Issue Date: Tuesday, August 6th, 2019
Issue Time: 9:15AM MDT
Summary:
A bit of a lull in heavy rain yesterday with some drying occurring at the low and mid-levels of the atmosphere. Moisture was effectively cutoff over western Colorado thanks to the westward movement of the high. However, some decent rainfall was still able to accumulate further to the south over the San Juan Mountains closer to the high. CoCoRaHS stations near Pagosa Springs recorded between 0.71 and 0.83 inches for the 24-hour period. Another station near Norwood, CO had 0.52 inches with quarter inch hail. Most other storms over western Colorado yesterday were high-based, so rainfall amounts were generally under 0.25 inches.
Back to the west, there were a few isolated showers over the Southeast Mountains and adjacent plains. Storm totals up to 0.8 inches were recorded over Pueblo County. There were also some thunderstorms over Weld County that moved in from the Cheyenne Ridge. No gages were in the area, but MetStorm estimated up to 1 inch fell over the area. The Fort Collins mesonet had two gages (4 miles apart) record just over 0.3 inches along Highway 14. As expected, there were no reports of flooding on Monday.
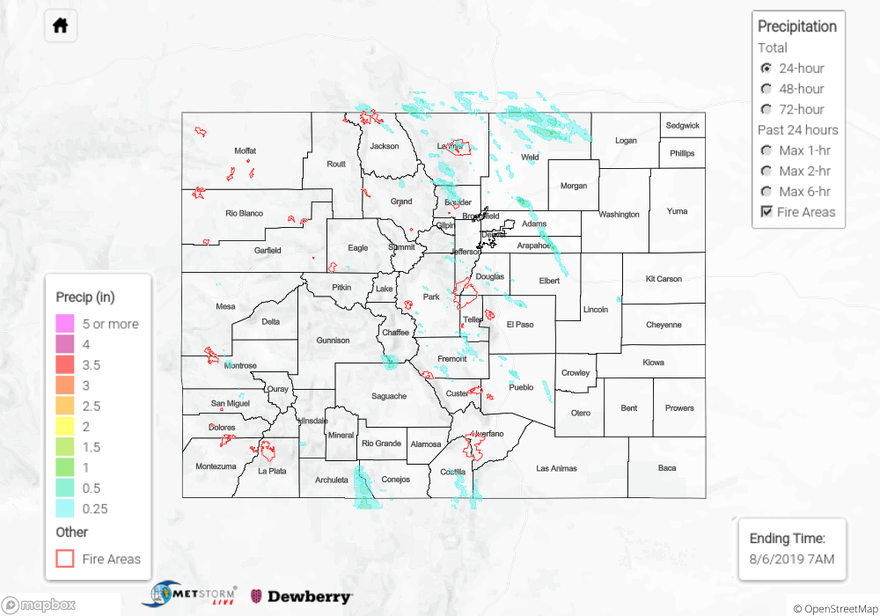
To see estimated precipitation totals over your neighborhood, scroll down the State Precipitation Map below.
Click Here For Map Overview