Issue Date: Saturday, August 3rd, 2019
Issue Time: 10:45AM MDT
Summary:
Upslope flow of moisture from the southwest and eastern plains provided moderate rainfall over the San Juan Mountains, Southwest Slope and Southeast Mountains. Storms moved off of the Southeast Mountains yesterday afternoon, providing decent totals over the foothills and adjacent plains. The highest accumulation yesterday was over Pueblo County, where radar derived up to 1.5 inches. CoCoRaHS stations reported moderate rainfall up to 1.15 inches near Colorado Springs in El Paso County. An Area Flood Advisory was issued at 2:45PM over the area, with a reports of urban and small stream flooding after 0.6 inches fell in 45 minutes. Flash Flood Warnings were issued last night around 8PM over the Spring Creek burn area, with law enforcement reporting flash flooding over the northeast portion of the burn area.
There were two reports of heavy rain over La Plata County near Hesperus and Archuleta County near Pagosa Springs of 1.0 and 0.69 inches respectively. Most of the precipitation fell overnight, but there were no reports of flooding due to the heavy rains. High winds and pea sized hail caused downed branches near Hesperus. Westerly flow aloft kept most other areas over the west pretty dry. An isolated storm near Pine Ridge to the north of Grand Junction in Mesa County recorded 0.21 inches. Air underneath the storm base was a little drier up to the north, which limited storms and rainfall over the northern Front Range and Urban Corridor. CoCoRaHS stations reported up to 0.31 inches in Boulder and Larimer Counties, with trace amounts over most of the Urban Corridor.
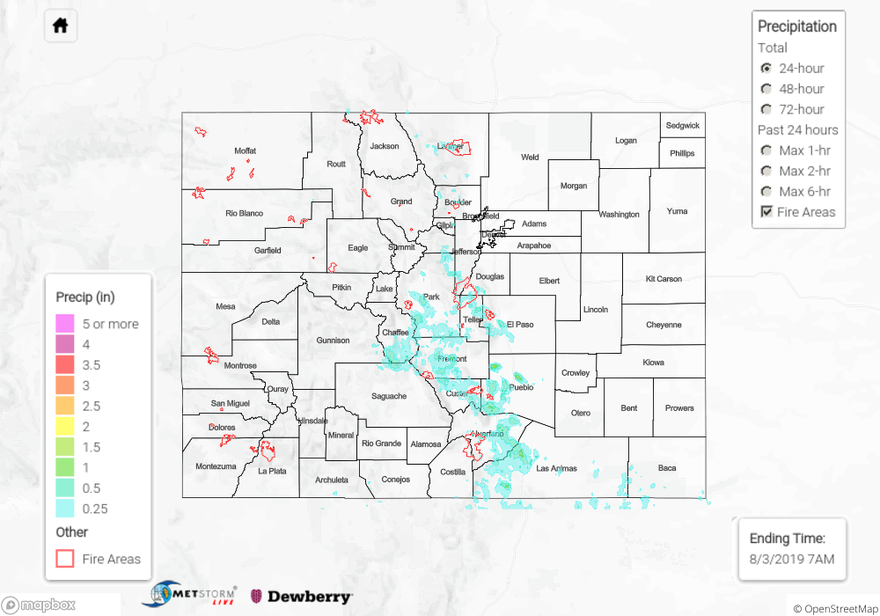
For a look at precipitation over your area, please visit the State Precipitation Map below. Note: the Grand Junction Radar is up and running again today, however totals over western Colorado are likely underestimated due to radar maintenance yesterday.
Click Here For Map Overview