Issue Date: Thursday, August 1, 2019
Issue Time: 10:45AM MDT
Summary:
Light and moderate rainfall was measured throughout the state yesterday as moisture increased steadily from the southwest. Storms began early in the afternoon over the Raton Ridge, where radar derived up to 0.5 inches, and a CoCoRaHS station reported 0.98 inches. An upslope moisture surge to the north of a surface low over the eastern plains produced thunderstorms over the Urban Corridor and areas of the southern Front Range around 6PM. Slow steering winds eventually pushed storms off to the east, but not before some decent rainfall totals were recorded over the Denver and Colorado Springs metro areas. CoCoRaHS reports up to 0.5 inches were measured throughout Jefferson and Denver Counties, and up to 0.4 inches over El Paso County. Back-building storms over the Palmer Ridge allowed for radar derived 2-3 hour rainfall totals up to 2 inches over eastern Adams County. An Areal Flood Advisory was issued by the NWS over the area last night around 6:30PM, but no flooding was reported.
To the west of the Continental Divide rainfall totals increased to the north, favoring the western state border. A moisture plume moving through Utah allowed for persistent storms over the Grand Valley and Northwest Slope. Heavy rainfall of 0.5 inches was reported to the NWS around 1PM yesterday near Plateau City in Mesa County. A RAWS station near Dinosaur National Monument in Moffat County reported 0.45 inches.
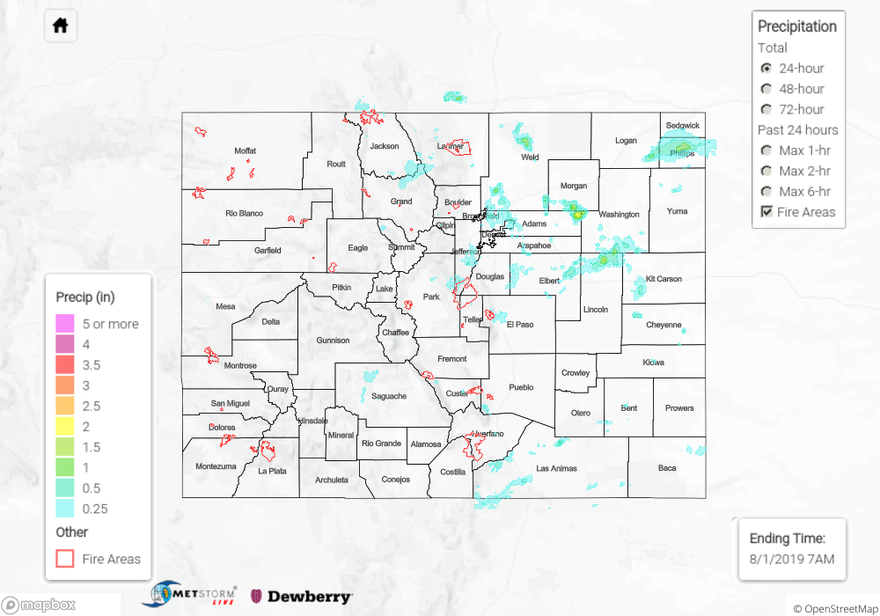
For a look at precipitation over your area, please visit the State Precipitation Map below. Note: The Grand Junction Radar is undergoing maintenance until August 3rd, so QPE over western Colorado may have underestimations over areas without observations.
Click Here For Map Overview