Issue date: Sunday, July 28, 2019
Issue time: 10:30AM MDT
Summary:
Moderate to severe thunderstorms were reported around the state yesterday as a shortwave passed over the area from the west. Upslope flow of moisture from the southwest created light to moderate rain over the Northwest slope and Grand Valley, with radar deriving up to 0.5 inches over the area. An Areal Flood Advisory was issued by the NWS around noon for small portions of Mesa and Delta Counties, with reports of heavy rain up to 0.21 inches. The main weather story for the day was over the southeast quadrant of the state, with reports to the NWS of:
3 miles east of Monument (El Paso County): 0.63 inches heavy rainfall
2 miles east of Pueblo (Pueblo County): 62 mph wind gust
4 miles south of Cheraw (Otero County): 58 mph wind gust
Hardscrabble Creek (El Paso County): Water rose 4 feet in 20 minutes but no flooding was reported
Areal Flood Advisories were issued by the NWS near the Junkins and Waldo Canyon burn areas, however no flooding was reported. CoCoRaHS stations in southern Douglas County and northern El Paso County reported the higheast accumulation for the day at 1.78 and 1.46 inches respectively, however measurements may have been contaminated by hail. Moderate to heavy rain was also reported over the Northeast Plains and in Larimer County, with radar deriving up to 1.5 inches (east) and 1 inch (west). CoCoRaHS stations in Larimer County reported up to 0.55 inches to the east of Estes Park.
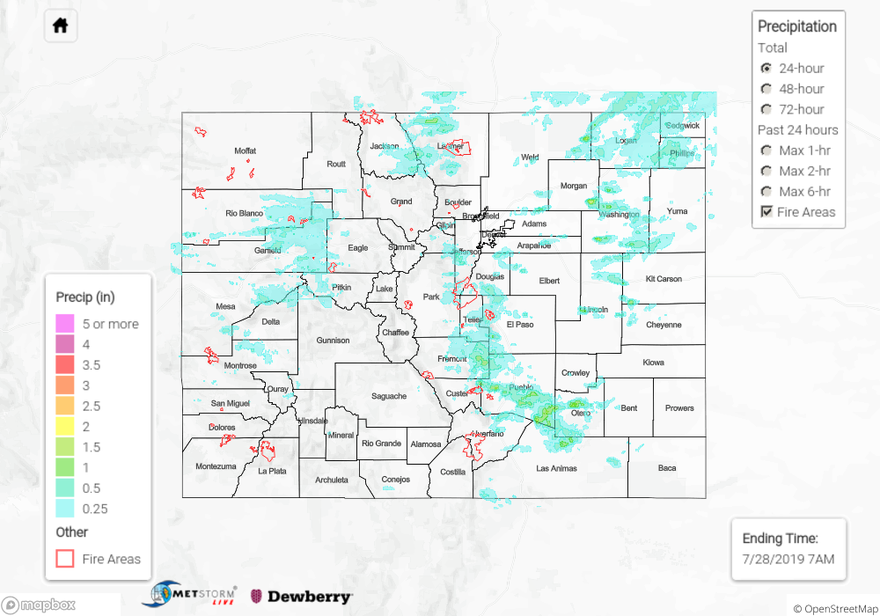
For a look at precipitation in your area, please visit the State Precipitation Map below.
Click Here For Map Overview