Issue Date: Friday, July 26th, 2019
Issue Time: 9:40AM MDT
Summary:
Not much change in the setup from Wednesday. The upper level ridge remained overhead with a PW surge bringing high moisture to both eastern and western Colorado. The main difference was some early day cloud cover limiting instability; thus, rain rates were a little bit lower than the prior day as well as total accumulations. Storms began to kick off over the higher terrains between 1:30 and 2PM MDT. Slightly faster steering flows also contributed to lower totals yesterday. As far as Local Storm Reports, there was a 0.88 inch report in El Paso County and 1.26 inch report further south over Custer County for the 24-hour period. Storms to the east triggered a couple Areal Flood Advisories from their respective NWS WFOs and one Flash Flood Warning for northwest Custer County. As of this morning, there were no reports of flooding for these areas of eastern Colorado. There was also some evening/night rain over the Southeast Plains. CoCoRaHS stations between Lamar and Springfield recorded between 1.5 and 1.8 inches in a 2-3 hour period.
Montrose County got the big storm of the day for western Colorado, which is a 2-day streak (if you can call it that). Thankfully, it did not fall over the Bull Draw burn area. Rainfall totals were generally estimated by radar to be in the 0.25 to 0.5 inch range at the cores of the storms favoring the San Juan Mountains for the highest accumulations. The Saguache airport recorded 0.19 inches for the day, and nearby RAWS stations to the west (steeper terrain) showed up to 0.57 inches of rain falling. Three day totals are starting to get up there with widespread totals between 0.5 and 0.75 inches over the San Juan Mountains and higher terrains of the Southwest Slope. Saturated soils are likely over this area as well as over the Southeast Mountains.
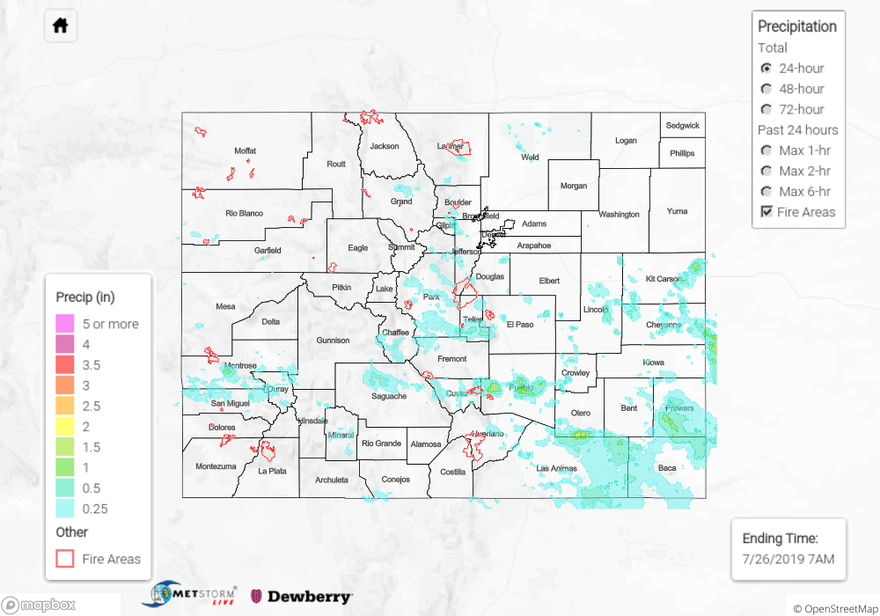
To see estimated precipitation totals over your neighborhood yesterday, scroll down the State Precipitation Map below.
Click Here For Map Overview