Issue Date: Wednesday, July 24, 2019
Issue Time: 10:45AM MDT
Summary:
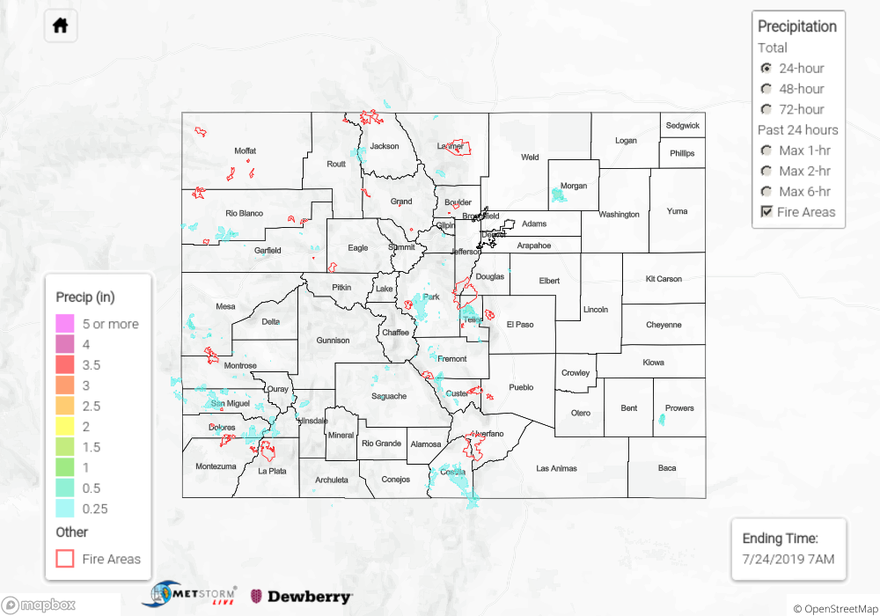
A calmer day yesterday compared to Monday, but there were still reports over severe thunderstorms and flash flooding near Colorado Springs. Storms over the area were driven primarily by upslope flow, peaking in intensity by 6PM. Reports to the NWS indicated 1 inch diameter hail over Teller Counter near Divide, with radar deriving from 1 to 2 inches of rain over the warned area between 5 and 6 PM. No flash flooding was reported in the area but CoCoRaHS stations reported up to 0.68 inches of rain. Temperatures increased higher than expected over the eastern plains, causing rainfall rates to be weaker than forecast over the Southeast Mountains due to reduced moisture. A brief thunderstorm over Morgan County produced up to 0.75 inches of rain, but the environment was unable to sustain the storm for long.
Moderate to heavy rain was also reported over the San Juan Mountains and Southwest Slope as moisture increased from the southwest. A CoCoRaHS station in Montezuma County recorded 0.78 inches of rain yesterday, but the thunderstorms were unable to cross the ridge to reach the 416 burn area. Precipitation in La Plata County was limited to less than 0.2 inches. Alamosa County had multiple reports of rain over the San Luis Valley, with CoCoRaHS reporting up to 0.2 inches in the city of Alamosa.
For a look at precipitation over your area, please visit the State Precipitation Map below.
Click Here For Map Overview