SPM 07-14-2021: Monsoon Moisture Produced Heavy Rain in Southwest Colorado

Issue Date: Wednesday, July 14, 2021
Issue Time: 9:45 AM MDT

Summary:

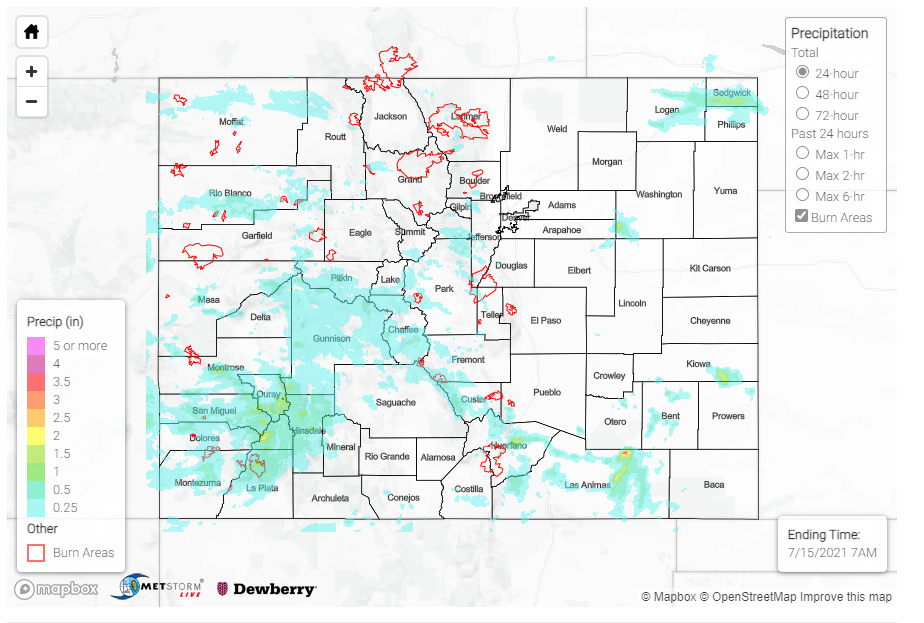
Monsoon season has arrived, bringing with it widespread rainfall, even heavy at times, to much of the state! However, the real winners yesterday were in the Southwest Slope, San Juan and Central Mountains, and Grand Valley.

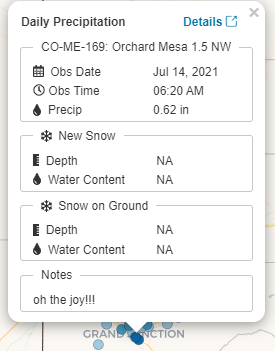
Tuesday began with an early morning, weak cold-front and associated low-pressure situated in Northeast Colorado – Southwest Nebraska, which pushed eastward out of the state with scattered, light rainfall across the Northeast Plains. By early afternoon, thunderstorms began filling in at the high elevations in the Northern, Central, Front Range, and San Juan Mountains, and then filled in to the Northwest and Southwest Slopes and Grand Valley as the afternoon progressed. The moisture just kept coming and continued to rain off and on for most the day in the southwest, bringing joy to many CoCoRaHS observers based on remarks on their daily reports.
As rainfall picked up, flood warnings and advisories were issued across the state, in addition to severe thunderstorm warnings for damaging winds and large hail. Wind gusts between 45-63 mph were ultimately recorded from storms across the Northwestern and Southwestern Slopes, Grand Valley, and Central Mountains. Many of the flash flood warnings were for previous burn areas. These include: The Decker burn scar and Poncha Pass – which closed earlier this month from debris flows, the Grizzly Creek burn scar – which closed I-70 in Glenwood Canyon to traffic again for several hours, and the Hayden Pass burn scar. Thankfully no additional flooding was reported on these scars.

Some notable rainfall totals across the Southwest Slope and San Juan Mountains:

  • A COOP observer in Gateway, on the CO-UT border, reported 1.00 inch in just 20 minutes! The 30-minute, 25-year ARI from NOAA Atlas 14 at this location is 0.94 inches, so Gateway saw just over a 25-year event!
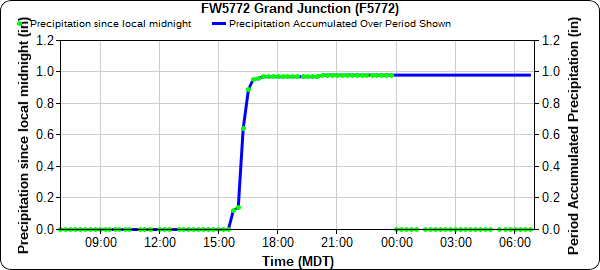
  • 0.98 in was observed on the south end of Grand Junction, most of that also falling in an hour around 4:00 pm.
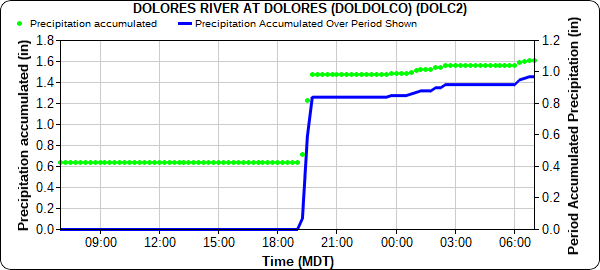
  • The Dolores River at Dolores station picked up 0.97 inches with most of that, 0.84 inches, falling within a 45-minute period after 7 pm.
  • A CoCoRaHS observer in Chromo, just north of the New Mexico border in Archuleta County, reported 0.95 inches.
  • A public report from Telluride came in at 0.78 inches.
  • Heavy rain was reported in Ouray, with a total of 0.71 inches from one CoCoRaHS observer. Minor street flooding was also reported there from a nearby CoCoRaHS observer, who also reported 0.69 inches of rain.
  • And finally, a CoCoRaHS observer in Silverton reported 0.60 inches and said it was a “Great day with constant rumbles of thunder and steady rain”.

Rainfall totals along the Urban Corridor, Palmer Ridge, Eastern Plains were less than 0.25 inches aside from a few cells, including a line of storms along the I-76 corridor on the Northeast Plains. The day ended with a general clearing out overnight, until another late night-early morning system entered the state from the southwest, bumping up Southwest Slope and Grand Valley accumulations with additional modest rainfall.

For rainfall estimates in your area, check out the State Precipitation Map below!

Click Here For Map Overview

The map below shows radar-estimated, rainfall gage-adjusted Quantitative Precipitation Estimates (QPE) across Colorado. The map is updated daily during the operational season (May 1 – Sep 30) by 11AM. The following six layers are currently available: 24-hour, 48-hour and 72-hour total precipitation, as well as maximum 1-hour, 2-hour and 6-hour precipitation over the past 24 hour period (to estimate where flash flooding may have occurred). The 24-hour, 48-hour and 72-hour total precipitation contain bias corrections that are not disaggregated into the hourly estimates, so there will likely be some differences. The accumulation ending time is 7AM of the date shown in the bottom right corner. Also shown optionally are vulnerable fire burn areas (post 2012), which are updated throughout the season to include new, vulnerable burn areas. The home button in the top left corner resets the map to the original zoom.
Note: The 24-hour, 48-hour and 72-hour total precipitation do not contain bias corrections today due to errors in the CoCoRaHS data. This means there may be underestimations in QPE over the southwest and southeast corners of the state.
SPM 07-13-2021: Modest Precipitation in Southwest Slope

Issue Date: Tuesday, July 13, 2021
Issue Time: 8:45 AM MDT

Summary:

Yet another hot and dry day yesterday for most of the state, but some isolated afternoon showers produced very modest rainfall amounts in the Central and San Juan Mountains, between 0.01-0.03 inches scattered across the high elevations.

The Los Pinos Valley in the Southwest Slope benefitted from monsoonal moisture creeping up from New Mexico during an evening thunderstorm. Two CoCoRaHS observers in Bayfield (La Plata County) reported 0.41 and 0.57 inches from an evening thunderstorm, which included small, BB-sized hail. Observers remarked that even with the much-needed moisture, it was still not enough to clear out the smoke and haze from wildfires.

Conditions remained hot and dry over the fires burning in the Northern and Central Mountains, and gusty outflows from isolated thunderstorms increased winds and fire behavior while providing no relief in terms of precipitation. Air operations had to be limited over the Muddy Slide fire due to erratic winds. Smoke remained in the air due to fires in Colorado and the rest of the Western US.

Flooding was not reported on Monday. For rainfall estimates in your area, check out the State Precipitation Map below.

Click Here For Map Overview

The map below shows radar-estimated, rainfall gage-adjusted Quantitative Precipitation Estimates (QPE) across Colorado. The map is updated daily during the operational season (May 1 – Sep 30) by 11AM. The following six layers are currently available: 24-hour, 48-hour and 72-hour total precipitation, as well as maximum 1-hour, 2-hour and 6-hour precipitation over the past 24 hour period (to estimate where flash flooding may have occurred). The 24-hour, 48-hour and 72-hour total precipitation contain bias corrections that are not disaggregated into the hourly estimates, so there will likely be some differences. The accumulation ending time is 7AM of the date shown in the bottom right corner. Also shown optionally are vulnerable fire burn areas (post 2012), which are updated throughout the season to include new, vulnerable burn areas. The home button in the top left corner resets the map to the original zoom.

SPM 07-12-2021: Another Hot and Dry Day Across Colorado

Issue Date: Monday, July 12, 2021
Issue Time: 8:45 AM MDT

Summary:

Sunday was another hot and overwhelmingly dry day across Colorado. Afternoon storms in New Mexico briefly reached north into Colorado in the San Juan and Southeast Mountains, but little to no accumulation was observed. There was also a very brief, isolated evening shower in the Central Mountains, but again very little accumulation and mostly just virga. A CoCoRaHS observer in Buena Vista recorded just 0.02 inches, the highest precipitation total in the entire state.

Dry, northwesterly flow kept precipitation chances low, but also worsened conditions over the fires in the Central and Northern Mountains. This also resulted in continued smoke in the air, causing hazy skies and poor air quality.

No flooding was reported on Sunday. For rainfall estimates in your area, including antecedent rainfall, check out the State Precipitation Map below.

Click Here For Map Overview

The map below shows radar-estimated, rainfall gage-adjusted Quantitative Precipitation Estimates (QPE) across Colorado. The map is updated daily during the operational season (May 1 – Sep 30) by 11AM. The following six layers are currently available: 24-hour, 48-hour and 72-hour total precipitation, as well as maximum 1-hour, 2-hour and 6-hour precipitation over the past 24 hour period (to estimate where flash flooding may have occurred). The 24-hour, 48-hour and 72-hour total precipitation contain bias corrections that are not disaggregated into the hourly estimates, so there will likely be some differences. The accumulation ending time is 7AM of the date shown in the bottom right corner. Also shown optionally are vulnerable fire burn areas (post 2012), which are updated throughout the season to include new, vulnerable burn areas. The home button in the top left corner resets the map to the original zoom.

SPM 07-11-2021: Dry Day Across Colorado

Issue Date: Sunday, July 11, 2021
Issue Time: 9:00 AM MDT

Summary:

Yesterday started with cooler temperatures in the Mountains, Urban Corridor, and Eastern Plains from a late evening-overnight cold front the day before. The Western Slopes and Grand Valley however remained especially hot. Nearly no precipitation was observed across the entire state yesterday, only very small accumulations near the Kansas and Nebraska border from isolated storms, as well as a small cell around Cañon City – still, no precipitation exceeding 0.03 inches was observed. For rainfall estimates in your area, including antecedent conditions, check out the State Precipitation Map at the bottom of today’s post.

The main weather story was the presence of smoke in the air from fires in Colorado and throughout the Western US yesterday. Smoke in the air reduced air quality and left hazy conditions across the state. 9NEWS Meteorologist Cory Reppenhagen shared the following picture of the hazy sunset last night, looking west from the Urban Corridor:

Click Here For Map Overview

The map below shows radar-estimated, rainfall gage-adjusted Quantitative Precipitation Estimates (QPE) across Colorado. The map is updated daily during the operational season (May 1 – Sep 30) by 11AM. The following six layers are currently available: 24-hour, 48-hour and 72-hour total precipitation, as well as maximum 1-hour, 2-hour and 6-hour precipitation over the past 24 hour period (to estimate where flash flooding may have occurred). The 24-hour, 48-hour and 72-hour total precipitation contain bias corrections that are not disaggregated into the hourly estimates, so there will likely be some differences. The accumulation ending time is 7AM of the date shown in the bottom right corner. Also shown optionally are vulnerable fire burn areas (post 2012), which are updated throughout the season to include new, vulnerable burn areas. The home button in the top left corner resets the map to the original zoom.