SPM 09-12-2021: Third Day in a Row of Record-Breaking Heat – Thunderstorms Return

Issue Date: Sunday, September 12th, 2021
Issue Time: 10:30 AM MDT

Summary:

Saturday marked the third day in a row of record-breaking heat across Eastern Colorado, with highs in the upper 90s and low 100s for much of the Urban Corridor, Palmer Ridge, and Eastern Plains. Denver International Airport reached 97 degrees, breaking their previous record of 93. In Southern Colorado, all three long time climate stations broke records again: Colorado Springs reached 98 degrees, breaking the previous record of 90; Pueblo reached 101 degrees, breaking the previous record of 97; and Alamosa reached 89 degrees, breaking the previous record of 83. Colorado Springs also broke their September all time high temperature record, and Alamosa tied theirs!

A shift in the general weather pattern and break down in the high-pressure ridge that has been dominating the weather allowed for afternoon showers to return to the state. A disturbance that pushed in from the northwest caused high winds and some moderate precipitation in the Northwest Slope and Grand Valley. Meanwhile, daytime heating allowed for afternoon storms to fire up along the high elevations and spill onto the Urban Corridor and Eastern Plains.

The main threat from thunderstorms was high winds, with some especially gusty thunderstorms reported yesterday. A severe-warned thunderstorm in the Northeast Plains caused 89 mph winds gusts in Sterling, along with some reported small tree limb and roof damage. On the Northwest Slope, up to 75 mph wind gusts were reported in Meeker.

Precipitation totals were generally light, but some areas under a stronger cell were able to pick up moderate accumulations. The No Name Met Station near Glenwood Springs received 0.22 inches yesterday. A CoCoRaHS observer in Glade Park, west of Grand Junction, reported up to 0.38 inches, while Grand Junction itself received up to 0.22 inches. Along the Urban Corridor, Trace – 0.15 inches were reported from Fort Collins to Colorado Springs. Overnight, another disturbance brought widespread, gentle showers to the Grand Valley and Northwest Slope before dissipating.

No flooding was reported on Saturday. For rainfall estimates in your area, check out the State Precipitation Map below.

Click Here For Map Overview

The map below shows radar-estimated, rainfall gage-adjusted Quantitative Precipitation Estimates (QPE) across Colorado. The map is updated daily during the operational season (May 1 – Sep 30) by 11AM. The following six layers are currently available: 24-hour, 48-hour and 72-hour total precipitation, as well as maximum 1-hour, 2-hour and 6-hour precipitation over the past 24 hour period (to estimate where flash flooding may have occurred). The accumulation ending time is 7AM of the date shown in the bottom right corner. Also shown optionally are vulnerable fire burn areas (post 2012), which are updated throughout the season to include new, vulnerable burn areas. The home button in the top left corner resets the map to the original zoom.

SPM 09-11-2021: Excessive, Record-Breaking Heat in Eastern Colorado

Issue Date: Saturday, September 11th, 2021
Issue Time: 9:15 AM MDT

Summary:

Another day of record-breaking heat was promised and delivered on Friday. Temperatures were in the high 90s along the Western Slopes, Front Range Mountains, Urban Corridor, and Palmer Ridge; and then triple digit highs in the Eastern Plains. “Excessive heat” was recorded at two AWOS stations: Wray at 104 degrees and Burlington at 101 degrees on the Colorado-Kansas border, with many more excessive heat observations on the Kansas side.

Several record highs were broken along the Urban Corridor and Eastern Plains, shared in the following tweet from the Boulder WFO.

In Southern Colorado, all three long-term climate stations broke their daily records again. Alamosa also tied their all-time high September record, with the high of 89 yesterday.

Any precipitation was limited due to the very hot and dry air in which rain was falling through, resulting in more virga than actual rainfall accumulations. Still, a few Trace – 0.05 observations were made in Western Colorado from scattered convection. No flooding was reported on Friday.

Click Here For Map Overview

The map below shows radar-estimated, rainfall gage-adjusted Quantitative Precipitation Estimates (QPE) across Colorado. The map is updated daily during the operational season (May 1 – Sep 30) by 11AM. The following six layers are currently available: 24-hour, 48-hour and 72-hour total precipitation, as well as maximum 1-hour, 2-hour and 6-hour precipitation over the past 24 hour period (to estimate where flash flooding may have occurred). The accumulation ending time is 7AM of the date shown in the bottom right corner. Also shown optionally are vulnerable fire burn areas (post 2012), which are updated throughout the season to include new, vulnerable burn areas. The home button in the top left corner resets the map to the original zoom.

SPM 09-10-2021: Record Heat in Denver, Southern Colorado

Issue Date: Friday, September 10th, 2021
Issue Time: 8:40 AM MDT

Summary:

The high-pressure ridge covering the Western US continues to dominate our weather pattern in Colorado with yet another hot, dry, and hazy day thanks to smoke from western fires rotating around the ridge. The slow, eastward progression of the ridge has also allowed for temperatures to continue to creep up to record breaking heat with no precipitation in sight.

Several stations broke their record high temperatures yesterday. Denver saw a high of 96, breaking the previous record of 94 set in 1994. It’s often harder for Denver to see record heat due to the official observation location at DIA, which tends to be a few degrees cooler than within the city itself – making this new record that much more impressive!

In Southern Colorado, all three long-term climate stations broke their record high. Alamosa got up to 88, Colorado Springs to 96, and Pueblo to 99 degrees. The Pueblo WFO shared the following table with the previous records for each station.

As expected, no flooding was reported on Thursday.

Click Here For Map Overview

The map below shows radar-estimated, rainfall gage-adjusted Quantitative Precipitation Estimates (QPE) across Colorado. The map is updated daily during the operational season (May 1 – Sep 30) by 11AM. The following six layers are currently available: 24-hour, 48-hour and 72-hour total precipitation, as well as maximum 1-hour, 2-hour and 6-hour precipitation over the past 24 hour period (to estimate where flash flooding may have occurred). The accumulation ending time is 7AM of the date shown in the bottom right corner. Also shown optionally are vulnerable fire burn areas (post 2012), which are updated throughout the season to include new, vulnerable burn areas. The home button in the top left corner resets the map to the original zoom.

SPM 09-09-2021: Another Day of Near Record Heat, Smoky Air

Issue Date: Thursday, September 9th, 2021
Issue Time: 9:00 AM MDT

Summary:

Things are feeling a bit like a broken record, reporting yet another hot, dry, and smoky day across Colorado. There was no precipitation reported yesterday, and therefore no flooding due to heavy rain. The main weather story continues to be the heat and poor air quality. Most of Northern, Western, and Central Colorado, including the Urban Corridor, remained under air quality alerts yesterday thanks to wildfire smoke and summer ozone pollution. For the second day in a row, Alamosa reached 87 degrees – this time tying their previous record high of 87 set in 1977.

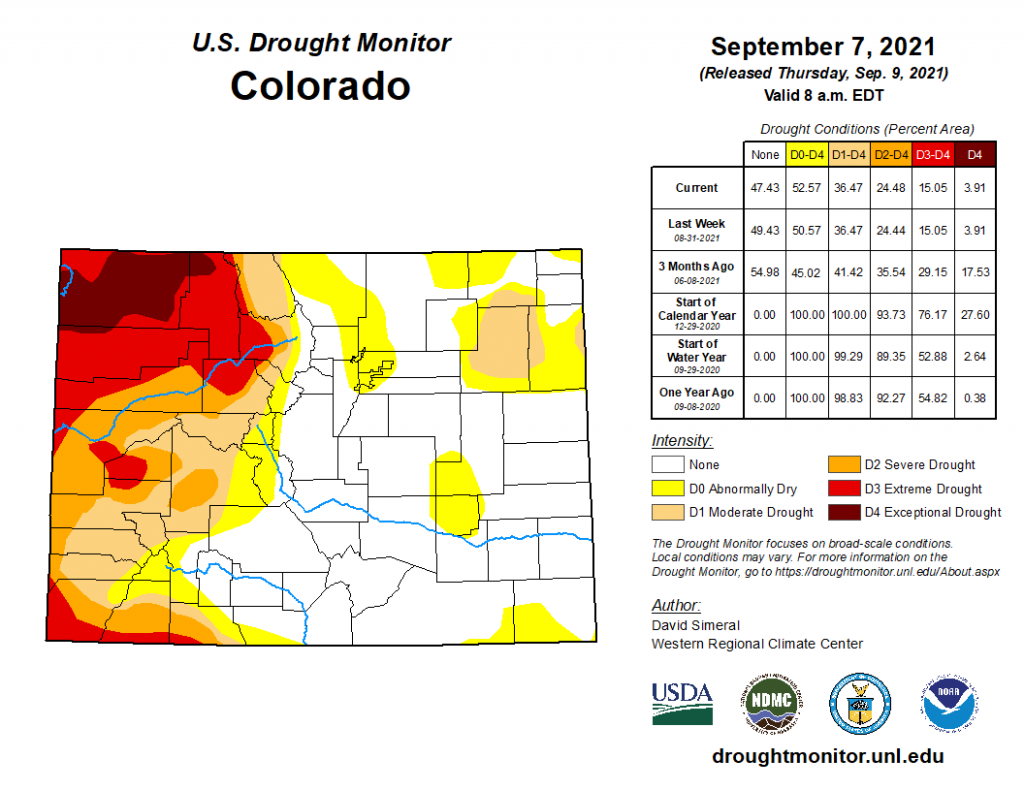
The U.S. Drought Monitor update was released this morning, representative of conditions as of Tuesday, September 7, as seen in the map and table below. While there was little change from last week, the total area of “D0 Abnormally Dry” conditions has continued to expand across Eastern Colorado after the dry summer, and now includes the Denver Metro Area. In the western half of the state, drought conditions dominate, and the Northwest Slope is still experiencing “D4 Exceptional Drought”. However, compared to just 3 months ago, the percent of area of exceptional drought has decreased from 17.53% of the Colorado, to now just 3.91%, with the Southwest Slope showing the most improvement after a helpful summer monsoon season. A comparison slider between different weeks of Drought Monitor updates can be found here.

Click Here For Map Overview

The map below shows radar-estimated, rainfall gage-adjusted Quantitative Precipitation Estimates (QPE) across Colorado. The map is updated daily during the operational season (May 1 – Sep 30) by 11AM. The following six layers are currently available: 24-hour, 48-hour and 72-hour total precipitation, as well as maximum 1-hour, 2-hour and 6-hour precipitation over the past 24 hour period (to estimate where flash flooding may have occurred). The accumulation ending time is 7AM of the date shown in the bottom right corner. Also shown optionally are vulnerable fire burn areas (post 2012), which are updated throughout the season to include new, vulnerable burn areas. The home button in the top left corner resets the map to the original zoom.