SPM 08-20-2017: Decreased Moisture Limits Showers to Eastern Plains

Issue Date: Sunday, August 20, 2017
Issue Time: 10:05AM MDT

Summary:

It has just been nothing but beautiful weather the last couple of days across the state. Yesterday was no exception. Limited moisture under the ridge reduced rainfall coverage over the mountains and adjacent plains. Storms produced gusty winds rather than heavy rainfall. In low moisture environments, when rain falls through a warm, dry layer, most of the rain will evaporate. As this happens, the air’s temperature will also be reduced in a process called evaporative cooling. The cooler air is less dense and quickly sinks, which helps produce the gusty winds.

A couple stronger storms were able to form over the eastern plains along the CO/KS border and Baca County where moisture was a little higher. A CoCoRaHS station in Baca recorded 0.8 inches for a warned severe thunderstorm. Radar rainfall estimates were just over 1 inch. Another later evening storm formed over the Palmer Ridge. A CoCoRaHS station in Hugo reported 0.25 inches, while radar estimates were just over 0.5 inches. Most of the general showers that formed yesterday produced between 0.1-0.2 inches.

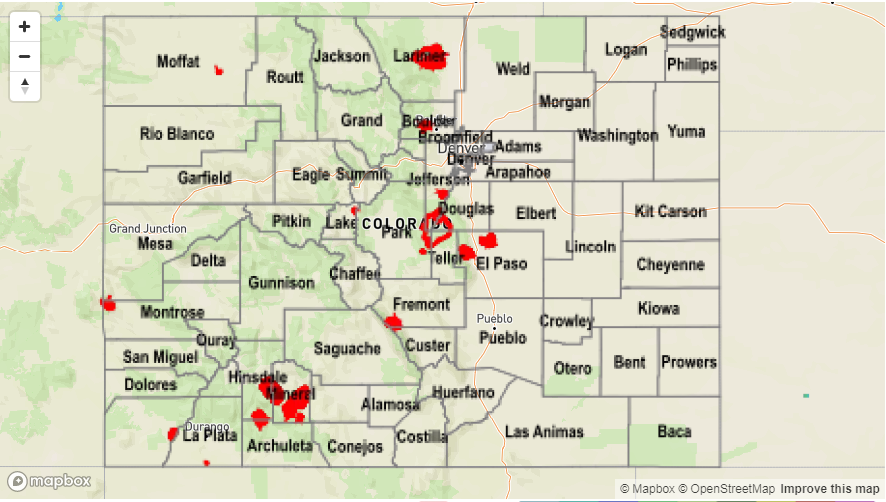
To see how much rainfall fell in your area, scroll down the State Precipitation Map below.

Click Here For Map Overview

The map below shows radar-estimated, rainfall gage-adjusted Quantitative Precipitation Estimates (QPE) across Colorado. The map is updated daily during the operational season (May 1 – Sep 30) by 11AM. The following six layers are currently available: 24-hour, 48-hour and 72-hour total precipitation, as well as maximum 1-hour, 2-hour and 6-hour precipitation over the past 24 hour period (to estimate where flash flooding may have occurred). The accumulation ending time is 6AM of the date shown in the bottom right corner. Also shown optionally are fire burn areas since 2012. The home button in the top left corner resets the map to the original zoom.

Note: We have identified a possible underestimation in QPE over the southwest part of the state. We are working to on this issue, and will provide an update as soon as possible.

SPM 08-19-2017: Enjoyable Sunshine with Isolated Light Showers

Issue Date: Saturday, August 19, 2017
Issue Time: 10:15AM MDT

Summary:

Another quiet day yesterday with partly cloudy skies over the mountains in the afternoon. The low moisture in the boundary layer was further scoured out by light, westerly flow. Limited instability and lack of moisture evaporated most storms that attempted to form. Showers over the mountains and adjacent plains produced precipitation totals under 0.25 inches. Not surprisingly, there were no flood reports yesterday. As far as high temperatures, portions of the eastern plains and SW corner of the state were just over 90F. A handful of places in the mountains were able to reach the 80F mark. Those highs today will likely repeat themselves and even increase a couple degrees.

The solar eclipse will begin Monday around 10:20AM (for the Denver area) with the peak sun cover just after 11:45AM. With no forecasted monsoon surge on Monday and the upper-level ridging pattern in place over the state, it looks like it will be a great viewing. There may be a few cumulus clouds that form during the event, but obstruction will be intermittent. For any other information about the eclipse itself, hop on over to the dedicated NASA page (https://eclipse2017.nasa.gov).

Since all rainfall totals were under 0.25 inches yesterday, there is no reflectivity on the SPM map below. Apologies for the old SPM map, there are technical difficulties with the new SPM map.

Storm Total Precip Legend

SPM 08-18-2017: Further Drying On Thursday, But A Few Severe Storms Across The Far East

Issue Date: Friday, August 18, 2017
Issue Time: 9:35AM MDT

Summary:

Quieter weather continued to overtake most of the state on Thursday as a cool front and dry air advection from the west limited instability. A few nuisance showers and weak thunderstorms popped up over the favored parts of the western Palmer Ridge and Front Range, scooting southeastward before dissipating. Up to 0.5 inches of rainfall occurred with the strongest of these storms, though this was by far the exception with most places recording a few tenths at best.

The only major exception to the calmer weather was in far eastern parts of the state where a few thunderstorms briefly turned severe in Baca and Yuma counties. The former storm was warned for large hail and gusty winds, but not much rainfall. The latter storm produced up to 1.5 inches of rainfall in about an hour over a localized area right along the New Mexico border. Fortunately, no flooding or severe weather reports were officially tallied with these storms, although they occurred over very rural areas with few observers and gages.

Finally, with the break in the active weather, we take a look at the extremely active period that occurred over the Arkansas River basin over the past 30-45 days. Below is the Arkansas River hydrograph at Las Animas. Note that after the spike on July 27, the river has stayed well above normal levels for the better part of 3 weeks. The volume of 30-day rainfall that fell in the area that drains into the gage below is near record levels. Fortuitously and quite surprisingly, the rain was spread out in time just enough to limit major flooding concerns. With the monsoon season still in its primetime, we will be carefully watching to see what the next few weeks’ worth of rainfall bring.

For rainfall estimates in your area, check out our State Precipitation Map below.

Click Here For Map Overview

The map below shows radar-estimated, rainfall gage-adjusted Quantitative Precipitation Estimates (QPE) across Colorado. The map is updated daily during the operational season (May 1 – Sep 30) by 11AM. The following six layers are currently available: 24-hour, 48-hour and 72-hour total precipitation, as well as maximum 1-hour, 2-hour and 6-hour precipitation over the past 24 hour period (to estimate where flash flooding may have occurred). The accumulation ending time is 6AM of the date shown in the bottom right corner. Also shown optionally are fire burn areas since 2012. The home button in the top left corner resets the map to the original zoom.

Note: We have identified a possible underestimation in QPE over the southwest part of the state. We are working to on this issue, and will provide an update as soon as possible.

SPM 08-17-2017: Rainfall Coverage and Intensity Decreased

Issue Date: Thursday, August 17, 2017
Issue Time: 9:35AM MDT

Summary:

With drier air slowly infiltrating into Colorado from the west, rainfall coverage and intensity decreased on Wednesday compared to Tuesday. Even so, scattered showers and thunderstorms still popped up, mainly limited to east of the Continental Divide. However, storms were smaller in size and were being steered by relatively strong winds. Thus, even the highest precipitation amounts were limited to about 0.75 inches over parts of El Paso and Cheyenne counties. Interestingly, very heavy rainfall was still noted, though only for a very short period of time. For example, an Urban Drainage and Flood Control District gage near Boulder picked up about 0.3 inches in 10 minutes (equivalent to a 1.8 inch per hour intensity).

Elsewhere, a cool frontal passage limited high temperatures to 5 – 10F below normal east of the Continental Divide. Meanwhile, to the west, seasonable temperatures with some afternoon sunshine was the rule.

Finally, it should be noted that the Arkansas River, the focal point of some very impressive rainfall over the past month, continued to recede and is now below Action levels at all major USGS gage sites.

Flooding was not reported on Wednesday. For rainfall estimates in your area, check out our State Precipitation Map below.

Click Here For Map Overview

The map below shows radar-estimated, rainfall gage-adjusted Quantitative Precipitation Estimates (QPE) across Colorado. The map is updated daily during the operational season (May 1 – Sep 30) by 11AM. The following six layers are currently available: 24-hour, 48-hour and 72-hour total precipitation, as well as maximum 1-hour, 2-hour and 6-hour precipitation over the past 24 hour period (to estimate where flash flooding may have occurred). The accumulation ending time is 6AM of the date shown in the bottom right corner. Also shown optionally are fire burn areas since 2012. The home button in the top left corner resets the map to the original zoom.

Note: We have identified a possible underestimation in QPE over the southwest part of the state. We are working to on this issue, and will provide an update as soon as possible.