Issue Date: Wednesday, September 12th, 2018
Issue Time: 09:25 AM MDT
Summary:
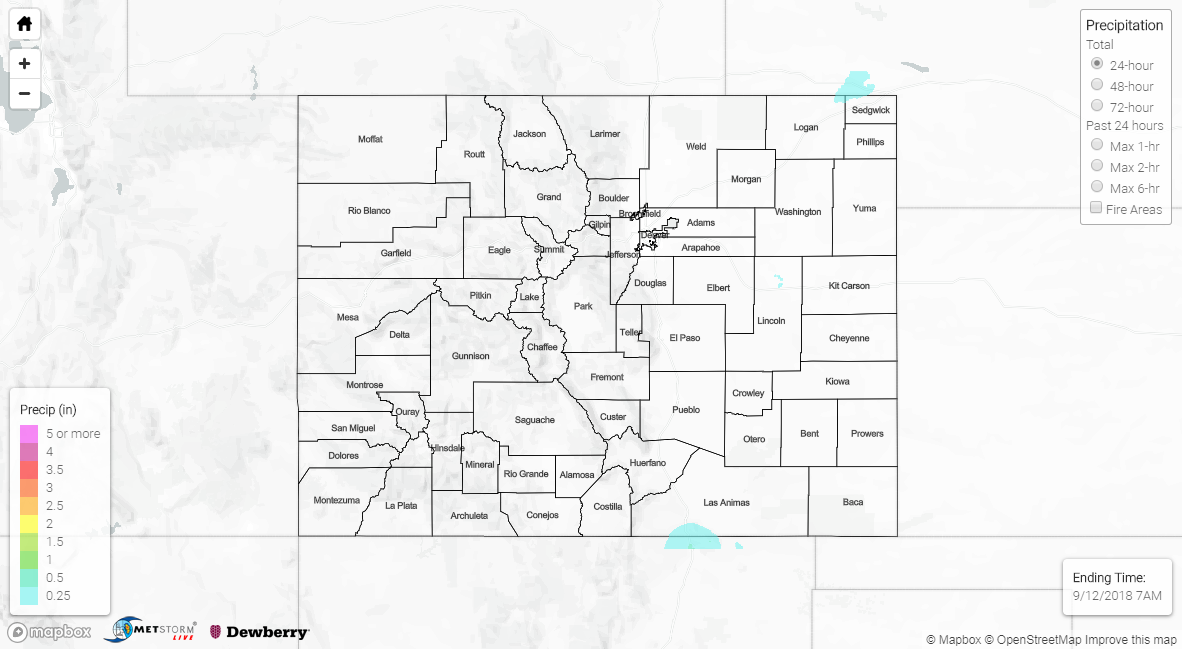
Beautiful day on Tuesday with a few broken high temperature records. A passing shortwave increased cloud cover over the northeast portion of the state and eastern high terrains in the afternoon hours. Not much rainfall to be had with these storms as drier air moved into the region from the southwest. The highest totals for the day were over the Northeast Plains/Palmer Ridge area. Radar rainfall estimations indicate just under 0.5 inches fell over this area. Over the northwest corner of the state critical fire weather returned. Most surface winds were in the 15-25 mph range, and there were some impressive gusts recorded. A Meeker ASOS recorded a gust of 45 mph and the Douglas Pass ASOS recorded a 53mph gust. Thankfully, no new fires were reported on day 1 of 3 with critical fire conditions.
To see how much precipitation fell over your neighborhood the last 72-hours, scroll down to the State Precipitation Map below.
Click Here For Map Overview
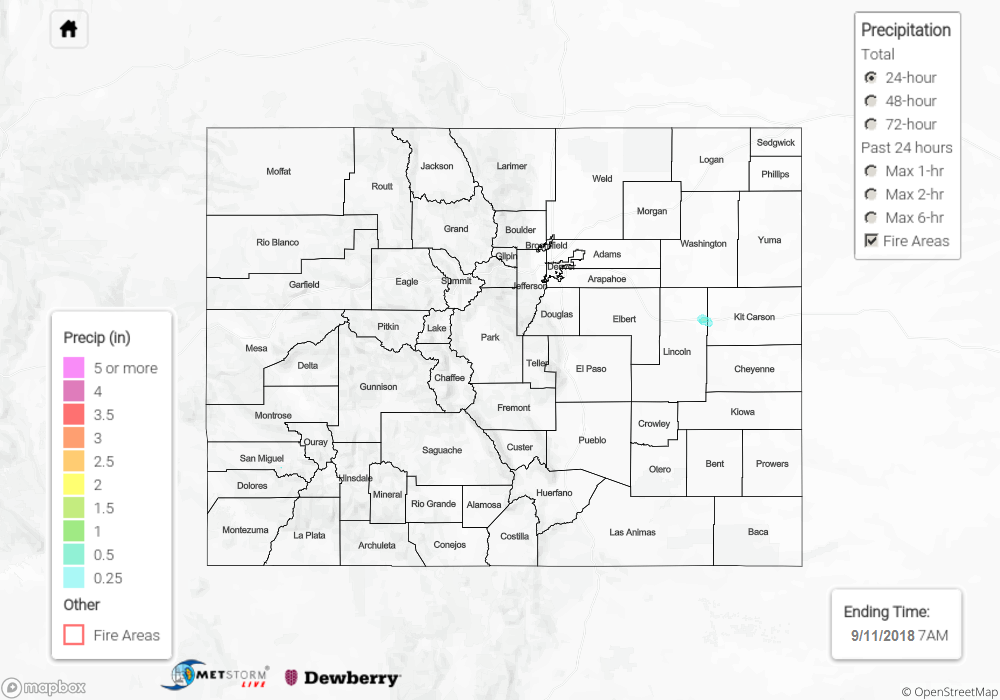
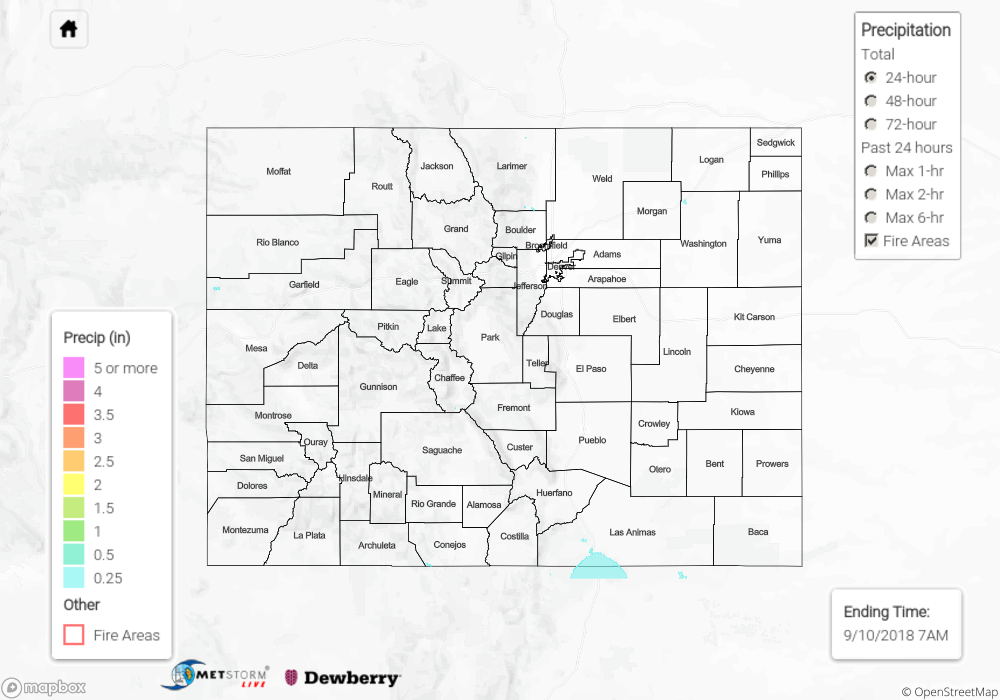
The map below shows radar-estimated, rainfall gage-adjusted Quantitative Precipitation Estimates (QPE) across Colorado. The map is updated daily during the operational season (May 1 – Sep 30) by 11AM. The following six layers are currently available: 24-hour, 48-hour and 72-hour total precipitation, as well as maximum 1-hour, 2-hour and 6-hour precipitation over the past 24 hour period (to estimate where flash flooding may have occurred). The 24-hour, 48-hour and 72-hour total precipitation contain bias corrections that are not disaggregated into the hourly estimates, so there will likely be some differences. The accumulation ending time is 7AM of the date shown in the bottom right corner. Also shown optionally are fire burn areas (post 2012), which are updated throughout the season to include new burn areas. The home button in the top left corner resets the map to the original zoom.